Evidence of continued growth:
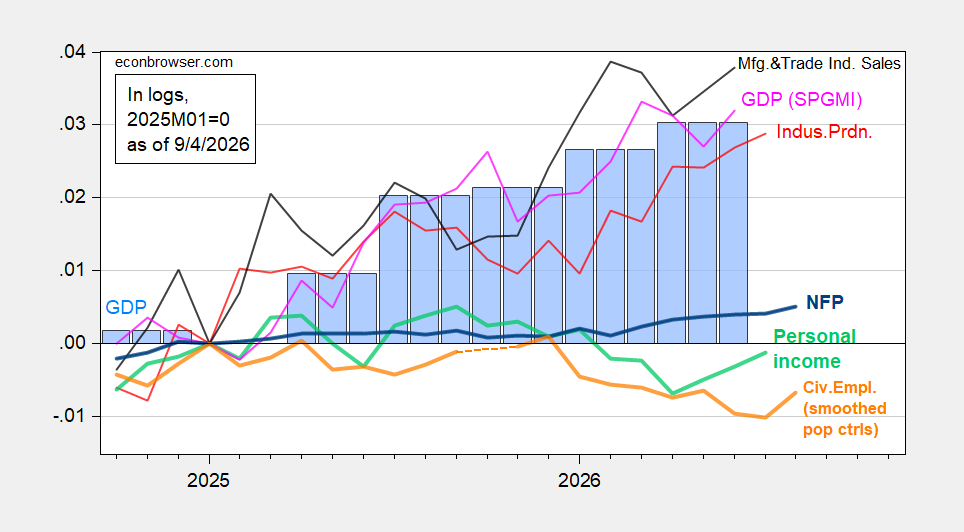
Figure 1: NFP employment (bold blue), civilian employment with smoothed population controls (bold orange), industrial production (red), personal income excluding current transfers in Ch.2017$ (bold light green), manufacturing and trade sales in Ch.2017$ (black), and monthly GDP in Ch.2017$ (pink), GDP (blue bars), GDPNow nowcast of 7/10 (light blue box), all log normalized to 2025M01=0. Source: BLS via FRED, BLS, Federal Reserve, BEA 2026Q2 2nd release, S&P Global Market Insights (nee Macroeconomic Advisers, IHS Markit) (8/3/2026 release), and author’s calculations.
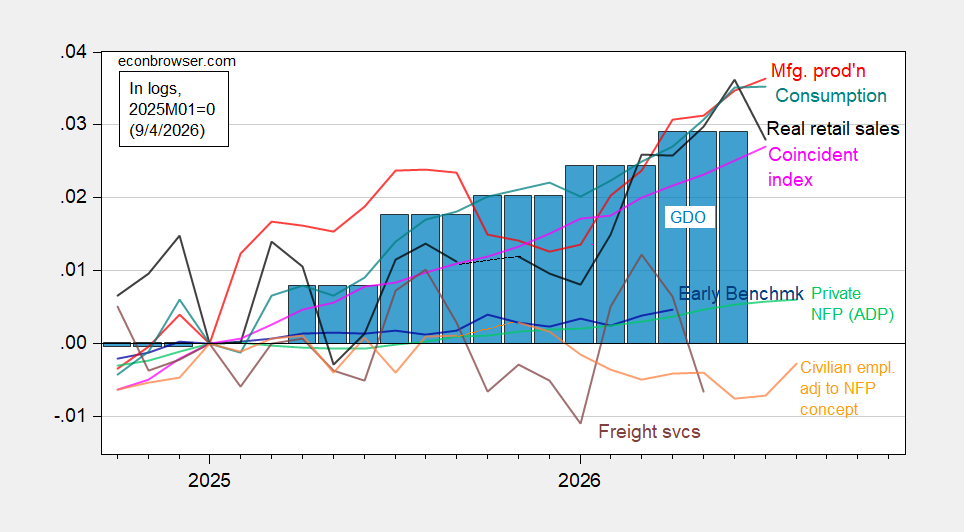
Figure 2: Civilian employment adjusted to NFP concept smoothed population controls, using experimental controls for 2025 (bold orange), manufacturing production (red), ADP private nonfarm payroll employment (light green), real retail sales, CPI deflated (black), freight services indexes (brown), and coincident index in Ch.2017$ (pink), GDO (blue bars), all log normalized to 2025M01=0. Source: BLS, ADP via FRED, Philadelphia Fed, Bureau of Transportation Statistics, Federal Reserve via FRED, BEA 2026Q2 2nd release, and author’s calculations.
Note that the employment release surprised not only in terms of change, but also in terms of previous months’ numbers.
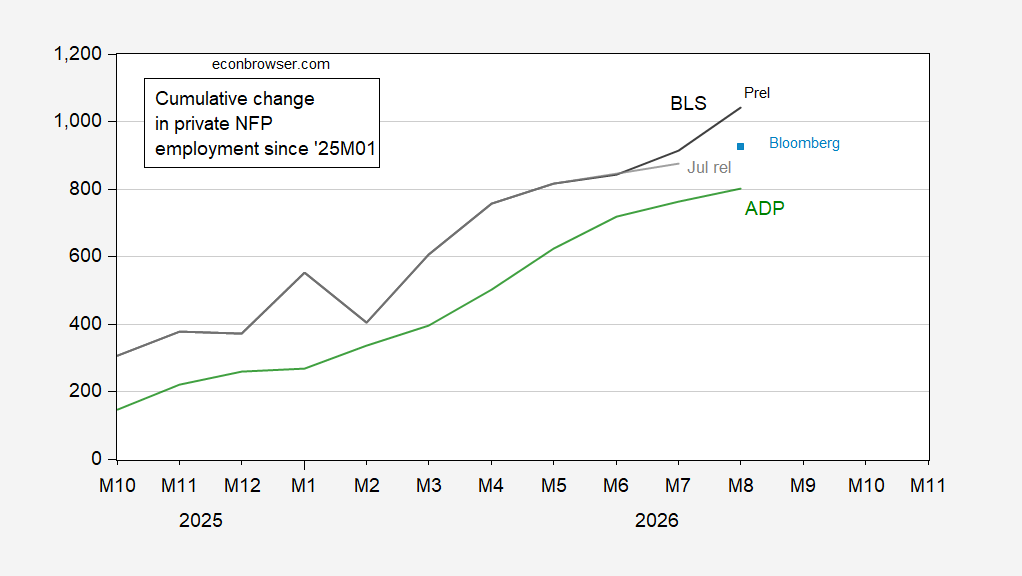
Figure 3: Change in private nonfarm payroll employment from CES August release (black), from CES July release (gray), Bloomberg consensus based on implied change (light blue square), ADP (green), all in 000’s, s.a. Source: BLS, ADP via FRED, and author’s calculations.