Evidence of continued growth:
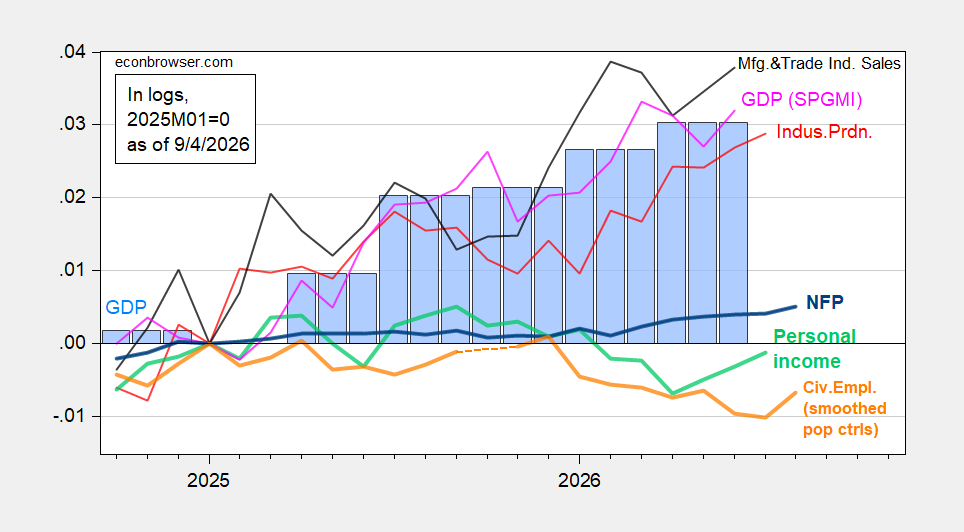
Figure 1: NFP employment (bold blue), civilian employment with smoothed population controls (bold orange), industrial production (red), personal income excluding current transfers in Ch.2017$ (bold light green), manufacturing and trade sales in Ch.2017$ (black), and monthly GDP in Ch.2017$ (pink), GDP (blue bars), GDPNow nowcast of 7/10 (light blue box), all log normalized to 2025M01=0. Source: BLS via FRED, BLS, Federal Reserve, BEA 2026Q2 2nd release, S&P Global Market Insights (nee Macroeconomic Advisers, IHS Markit) (8/3/2026 release), and author’s calculations.
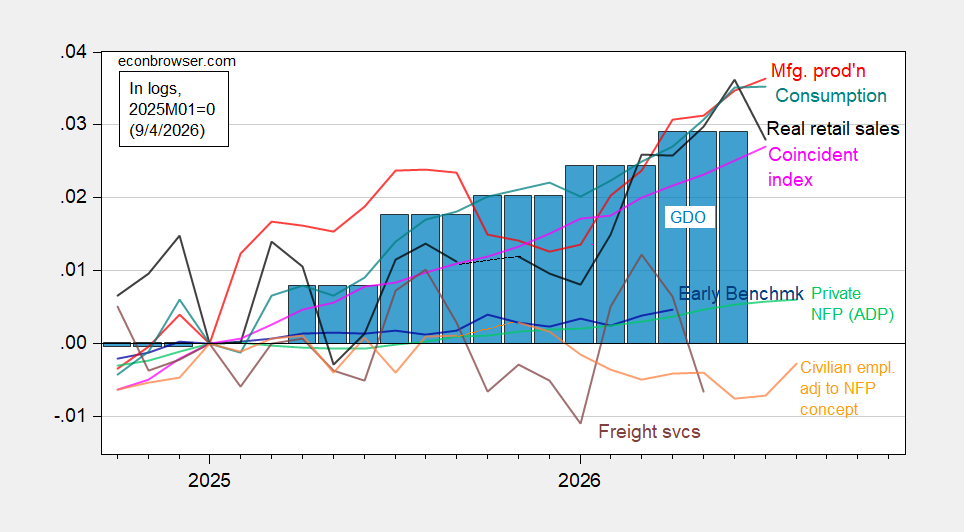
Figure 2: Civilian employment adjusted to NFP concept smoothed population controls, using experimental controls for 2025 (bold orange), manufacturing production (red), ADP private nonfarm payroll employment (light green), real retail sales, CPI deflated (black), freight services indexes (brown), and coincident index in Ch.2017$ (pink), GDO (blue bars), all log normalized to 2025M01=0. Source: BLS, ADP via FRED, Philadelphia Fed, Bureau of Transportation Statistics, Federal Reserve via FRED, BEA 2026Q2 2nd release, and author’s calculations.
Note that the employment release surprised not only in terms of change, but also in terms of previous months’ numbers.
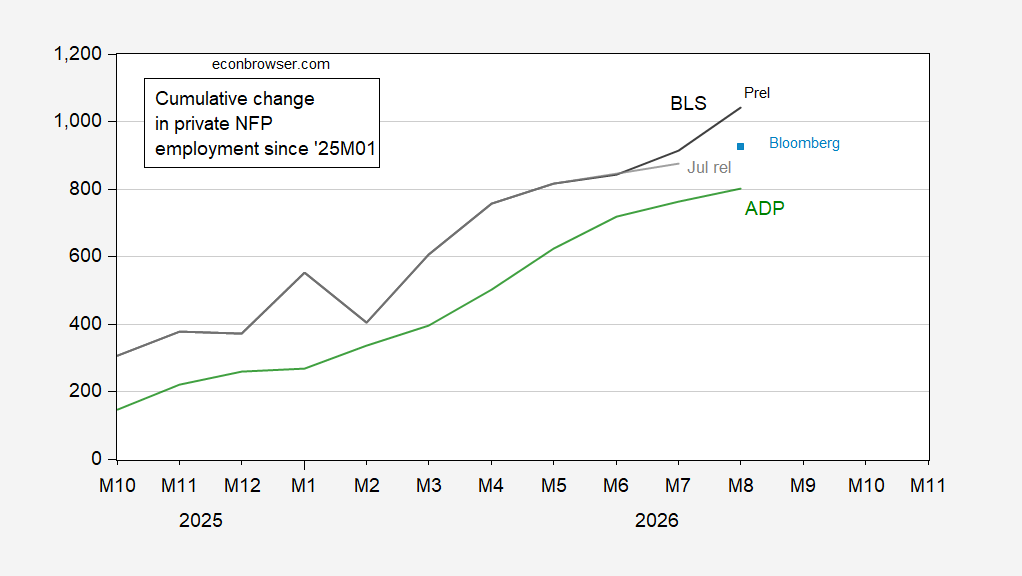
Figure 3: Change in private nonfarm payroll employment from CES August release (black), from CES July release (gray), Bloomberg consensus based on implied change (light blue square), ADP (green), all in 000’s, s.a. Source: BLS, ADP via FRED, and author’s calculations.
The statistical method used for measuring employment changes seems complex for a general reader. My personal experience with these figures shows a significant lag between data release and actual economic shifts.
Of course then come downward revisions come in, they have been bad since Covid. Month to month they move, in big and small amounts, when CPS declines next month, what then??? The US economy
I am going to say something else: after the 2000’s debt bubble popped, A large part of where U-series and its related jobless claims got data also died with it. Instead something called the gig economy came up in its place. Off book, contractors. They don’t take claims. They don’t exist in useries equations or CPS. This is why we see such mismatches. Its also why jobless claims fell, unemployment fell despite supposed weak growth in the 2010’s. A whole part of the Labor market basically lives off gigs. I would add 2% to the unemployment rate. Notice then it starts adding up. Average. not great. Respect the actually happening in a economy, not some 30-70 years ago government bean counter data which frankly, isn’t that good anymore.
Bad idea. Abandoning data and relying on impressions leaves us with less imformation, not more. If there are problems with the data, then fix them. If we don’t yet have a fix for the data, then judgement can be used in evaluating the data we have. Relying only on impressions is not going to help.
It’s a valid point that when we talk about employment and unemployment then we need to account for gig-work. My guess is that most of them are still job seekers – but we need data.