Analysis of current economic conditions and policy
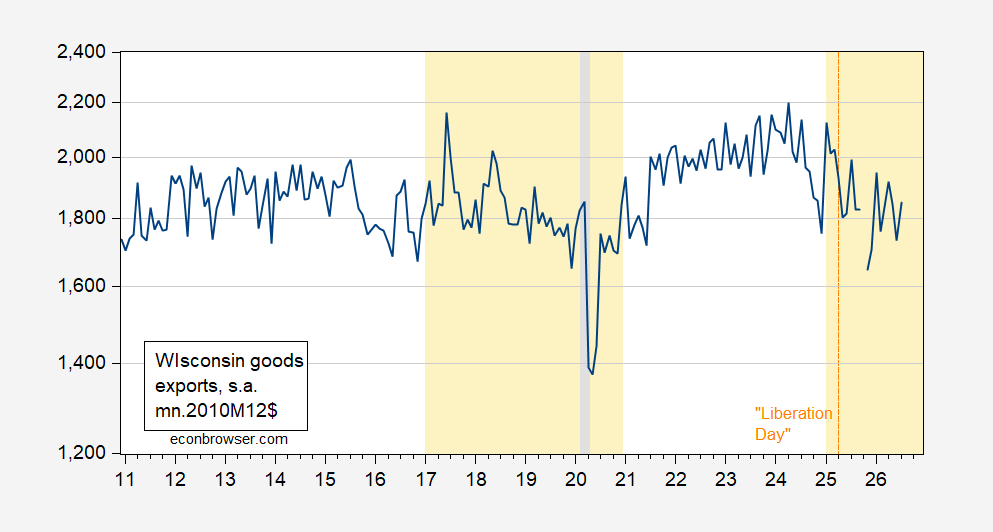
Wisconsin Exports under Trump
Down, under Trump 1.0 and Trump 2.0:
Figure 1: Wisconsin goods exports, mn.2010M12$ (blue). Deflated using US export price index ex food & fuels. Source: Census, BLS and author’s calculations.
Good news from BLS for a change. Alas Team Trump will be saying it’s the best economy ever – which it is not.
James
Please send this on to corporate media – so Republicans will stop saying the GOP is “good for business.”
The August Employment Report: June + July were revised to now 55,000 jobs more than previously reported. With revisions we are now at 31K + 21K + 162K = 214K or about 71,000 jobs/month over June–August. I would call that a a slow-growth labor market, The biggest payroll gains were in food services, local-government education, manufacturing and health care. So a lot of teachers going back to work with school year.
Overall LFPR rose from 61.4% to 61.6%. But looking at bigger picture – January 2026: roughly 62.1% and August 2026: 61.6%. So we’re still down about 0.5 percentage point since January and BLS highlights that decline.
I am tracking the Prime Age (25-54) LFPR – The prime-age LFPR has been extraordinarily high, but it has stopped climbing. It reached approximately 84%+ earlier this year, with January 2026 around 84.1%, before moving lower.
Overall I would say labor supply is becoming increasingly constrained while economic growth becomes increasingly dependent on productivity and a shrinking pool of prime-age workers.
pgl
fred.stlouisfed.org/series/B1448C1A027NBEA
Net farm income, USDA
Trump is pretending he’s the savior of US farmers talking about how much farm income fell in 2023. Maybe he can get EJ Antoni to draw a graph that misleads but I have asked FRED to d
raw its reliable graphs which show 2022 was a record year for net farm income.
Macroduck
BLS reports 162,000 new jobs in August (3-month average 71,000) or 569,000, depending on the survey. Private jobs up 127,000 vs 38,000 from ADP. Hourly earnings up 0.3%. Pretty good.
Market reaction has been tame, with odds of higher Fed rates up only a bit, 10-year yield up just 1 basis point.
Not that the labor market matters to Fed policy, right? The Fed makes rate decisions based on the outrageousness of the latest threat from the felon-in-chief. Today’s threat: “Cut rates or I shoot the economy! With my tariff gun! You guys can cause inflation, or I’ll cause inflation. It’s your choice.”
Ivan
Do as I say or I will shoot myself in the foot ! – the Orange Clown is getting weirder. Its not just that he don’t seem to get basic economics, he comes out with a new, often contradictory, economic theory every other day.
To be fair my FRED graph of farm income was in nominal terms. This link shows it in real terms. The decline was significant but it was far from the lowest inflation adjusted level.
http://www.bls.gov/news.release/empsit.nr0.htm
Good news from BLS for a change. Alas Team Trump will be saying it’s the best economy ever – which it is not.
Please send this on to corporate media – so Republicans will stop saying the GOP is “good for business.”
The August Employment Report: June + July were revised to now 55,000 jobs more than previously reported. With revisions we are now at 31K + 21K + 162K = 214K or about 71,000 jobs/month over June–August. I would call that a a slow-growth labor market, The biggest payroll gains were in food services, local-government education, manufacturing and health care. So a lot of teachers going back to work with school year.
Overall LFPR rose from 61.4% to 61.6%. But looking at bigger picture – January 2026: roughly 62.1% and August 2026: 61.6%. So we’re still down about 0.5 percentage point since January and BLS highlights that decline.
I am tracking the Prime Age (25-54) LFPR – The prime-age LFPR has been extraordinarily high, but it has stopped climbing. It reached approximately 84%+ earlier this year, with January 2026 around 84.1%, before moving lower.
Overall I would say labor supply is becoming increasingly constrained while economic growth becomes increasingly dependent on productivity and a shrinking pool of prime-age workers.
fred.stlouisfed.org/series/B1448C1A027NBEA
Net farm income, USDA
Trump is pretending he’s the savior of US farmers talking about how much farm income fell in 2023. Maybe he can get EJ Antoni to draw a graph that misleads but I have asked FRED to d
raw its reliable graphs which show 2022 was a record year for net farm income.
BLS reports 162,000 new jobs in August (3-month average 71,000) or 569,000, depending on the survey. Private jobs up 127,000 vs 38,000 from ADP. Hourly earnings up 0.3%. Pretty good.
Market reaction has been tame, with odds of higher Fed rates up only a bit, 10-year yield up just 1 basis point.
Not that the labor market matters to Fed policy, right? The Fed makes rate decisions based on the outrageousness of the latest threat from the felon-in-chief. Today’s threat: “Cut rates or I shoot the economy! With my tariff gun! You guys can cause inflation, or I’ll cause inflation. It’s your choice.”
Do as I say or I will shoot myself in the foot ! – the Orange Clown is getting weirder. Its not just that he don’t seem to get basic economics, he comes out with a new, often contradictory, economic theory every other day.
/www.agweb.com/news/business/taxes-and-finance/ugly-truth-2023-and-2024-will-go-down-two-largest-declines-net-farm
To be fair my FRED graph of farm income was in nominal terms. This link shows it in real terms. The decline was significant but it was far from the lowest inflation adjusted level.