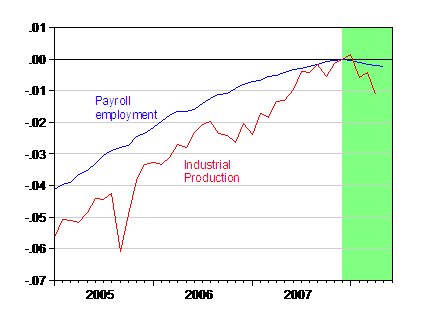
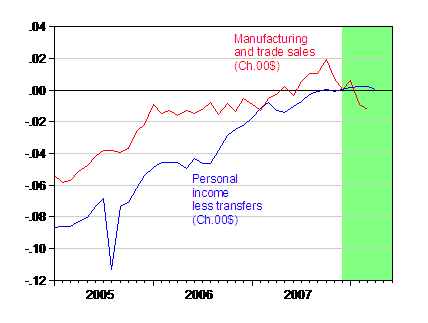
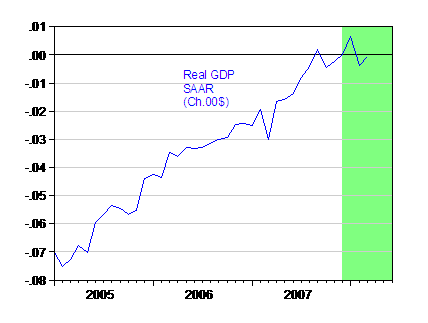
Since December 2007 is a commonly identified turning point [1], [2], I thought it would be of interest (given Jim’s take on whether it matters if we’re in a recession) to see what the indicators that the NBER BCDC focus on — payroll employment, industrial production, real personal income less transfers, real manufacturing and trade sales, and to a lesser extent monthly real GDP — are doing. They’re declining…

Figure 1: Log payroll employment (blue) and log industrial production (red), both normalized to 0 in 2007M12. Green shaded area is conjectured recession dates. Source: Federal Reserve Board via St. Louis Fed FRED II, accessed 8 June 2008.

Figure 1: Log personal income less transfers in Ch.2000$ (blue) and log manufacturing and trade sales in Ch.2000$ (red), both normalized to 0 in 2007M12. Real personal income calculated by subtracting off transfers from personal income, and deflating by the personal consumption expenditure deflator. Green shaded area is conjectured recession dates. Source: BEA GDP release of 29 May, and Supplemental Table 2BU, and St. Louis Fed FRED II, accessed 8 June 2008, and author’s calculations.

Figure 3: Log GDP in Ch.2000$, normalized to 0 in 2007M12. Green shaded area is conjectured recession dates. Source: Macroeconomic Advisers [xls], May 15, 2008 release.
One point to keep in mind, when comparing against previous downturns: for the last few months, the indicators are either preliminary or once/twice revised, while viewing back in time, one will be looking at final, revised, data. For the issue of vintage data and revisions, see these posts (see Creative Destruction, as well as these posts [3], [4], [5]). To access vintage data, see the St. Louis Fed’s ALFRED system.
With that caveat in mind, it looks to me like we’ve passed at least a local maximum, and indicators are trending down.
[Update: 8:07AM Pacific, June 9]
kharris has mentioned that in the past I’ve included two series of monthly GDP. I was trying to hew closely to the NBER BCDC focus series, but since you asked, from e-forecasting, June 6 release:
May Report —
Difficult to Avoid GDP Decline in Second Quarter
May GDP–Flash Estimate
Our next GDP report– 2nd estimate of May GDP — will be released Tuesday, June 17th.
Editor: Maria E. Simos
According to e-forecasting’s Flash Estimate of U.S. Monthly GDP, the nation’s output of goods and services, declined in May.
Following a decline of 2.7 percent in April, the real-time monthly GDP, expressed at seasonally adjusted annual rates in chained 2000 prices, fell 0.5 percent in May to $11,680.9 billion.
Looking at the annual growth rate of monthly GDP’s three-month moving average from three months ago, the economy’s output in May remained unchanged as the growth rate posted 0 percent. This
growth rate is the monthly equivalent to the publicized GDP quarterly growth rate from the preceding quarter. In reality, the growth rate of the three months ending in the last month of the quarter is identical to the quarterly growth rate.
The six-month smoothed annual growth rate of the U.S monthly real GDP, which historically has signaled the recession phases of the business cycle, recorded a positive reading of 0.4 percent in May,
after posting a positive growth rate of 0.7 percent in April. This compares to a long-term annual average growth rate of 3.3 percent during 1959-2006.…
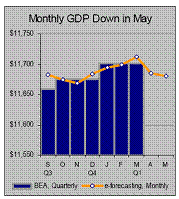
Here’s the key graph from the report:

Figure 4: Monthly GDP estimate from e-forecasting, June 6 release.
This picture is not exactly more encouraging, and speaks to Ira Silver‘s point.
Via Barry Ritholtz, Floyd Norris of the NYT points to the year-on-year, seasonally unadjusted private sector payroll as an infallible concurrent indicator of recessions. He says we’re in a recession.
While any indicator is fallible (government hiring could be booming, for example, or revisions could turn things around), the precedents he cites are persuasive.
Haven’t you featured two monthly GDP series? One from Macro Advisors and one from somebody else (sorry)? If not you then somebody on near-by blog turf. The two show decidedly different patterns since December, though both show some very weak months.
It appears that there is a good chance that there will be no quarterly decline in real GDP this year.
The NBER has never called a recession without at least one quarter of decline in real GDP. In fact, all post-war recessions have had at least two quarters of decline (although not necessarily consecutive).
A recession call by the NBER seems less sure than many think unless the July GDP revisions show at least one quarterly decline in real GDP.
I use to track them this way, it is also a nice graph (value variables deflated by PCE) http://tinyurl.com/4rgvm4
I’ve got retail sales, though. Got to improve on that one.
Wow, those guys and gals at e-forecasting are really precise. By my reckoning, an annualized drop in GDP of 2.7% is equal to a monthly drop of 0.22%. Even better for May, an annualized drop of 0.5% translates into a measured drop for May of .04%. These guys are good!
There is a very troublesome problem in the blogosphere with showing inadequate data to argue a point of view.
Take the first chart showing IP decline, for example.
Going back to 1960 there have been 7 recessions. However, there have been *14* instances when IP fell by *more* than the amount of the current decline from a 1-year peak. Of the 7 instances that didn’t occur during or immediately surrounding a recession, 5 occurred *18 months or more* before the start of an NBER recession.
This pattern of significant drops from a peak in the *middle* of a cycle (and not just surrounding recessions) also occurred with 2 other NBER indicators, real manufacturing and trade sales, as well as real personal income.
The Q1 2008 real GDP number (and it’s upward revision) clearly don’t support imminent recession, either.
I’m just saying let’s be a little more circumspect about “conjectured” recessions unless there’s sufficiently strong probability.
Sebastian
It is difficult to have any good idea what happened to real GDP in May before the May retail sales numbers are released. This is particularly true given the rebates being received in May and June.
The major retailers reported better results in May than had been expected. Wal-Mart specifically mentioned a benefit from stimulus checks. The world’s largest retailer said same-store sales rose 3.9 percent, or 4.4 percent including fuel sales, while analysts surveyed by Thomson Financial had predicted a 1.6 percent rise.
Sebastian: Point well taken. But as I’ve noted in previous posts, in May 2001 the preliminary GDP release for 2001q1 indicated positive growth… [1].
As an aside, you’ll note my concluding line: “…it looks to me like we’ve passed at least a local maximum, and indicators are trending down.” I didn’t say we were in a recession.(The “conjectured” recession dates are others’, not mine, I should’ve noted.)
Rich Berger: Well, I agree it would be nice to have a sufficiently long track record so as to show standard errors going from advance to preliminary to final, etc., as is done with the BEA GDP numbers. We encounter a similar sort of imprecision with BEA numbers, but I don’t see you critiquing those numbers in the same way. My preference would be for all series to have the standard errors to be reported always (I try to note those when I discuss GDP releases).
Menzie-
My serious point is that macroeconomic measurements are often given more credibility than warranted. Given that GDP numbers (and many other metrics) are seasonally adjusted, deflated and annualized means that small imprecisions in any of the calculations can mean big difference in the real, annual rate of growth. With so much data available, almost any point of view can find some “fact” to justify itself. There is a tremendous amount of uncertainty now and a large amount of fear. Someone has said “Never take counsel of your fears”. Tough to do at times, but fear is the enemy of clear thinking. As far as the economy goes, I prefer to reserve judgement while getting as much information as I can, which includes reading your excellent blog.
Related, folks can call this data mining if they want, but the Conference Board’s new employment trends index looks interesting and useful:
http://www.conference-board.org/pdf_free/economics/ETI090608.pdf
The eight metrics that compose it make sense. That it is so sensitive to changes in employment is very helpful.
Not pretty, the picture that it is painting.
Hello James, this is the first time for me in your web log, i’m italian and i’ve a question for you:
as do you explain the US monetary policy (where we can observe a costant level of interest rates) with the high level of commodities prices? According with Jeffrey Frankel (cfr. The Effect of Monetary Policy on Real Commodity Prices) we should observe higher interest rates with higher crude oil spot/futures prices. Isn’t Trichet policy more choerent than US money policy?
Thanks in advance for your answer
Willy, in the “search” box on the econbrowser main page, try “Frankel” or “commodity” to get some of our discussion of this issue.
Than you very much!
The price of oil has been raised slowly and deliberatly over the last several months and I can explain why.
The current demand and supply does not indicate nor dictate oil being at $139 per barrel. This is actually about twice what the price should be based on current demand and supply.
The price has been artifically raised because a signifacant supplier is going to be eliminated. Thus affecting the total supply (production) and the price.
If this significant supplier were eliminated and the price of oil suddenly went up or doubled there would be a lot of upset and angry people out there. It would not be politically or economically accepted. They would not agree that the elimination of this significant oil supplier (producer) was worth the increase in the price of oil.
Thus, for political reason and appeasement the price of oil has been raised artifically in anticipitation of this significant producers’ elimination.
So when this producer or it’s ablity to supply oil is eliminated the price of oil will not rise
very much. Their elimination (or annihilation) will be much more accepted.
George,
Are you infering that an attack on Iran is in the near term? Lets say before 1/20/09? If so I agree. Maybe not the US led but US supported.
I think most economic models and forecasting tools must be kept simple to be effective. The recession indicator used on my website is simple and has accurately predicted the last three recessions in real time. It predicts recessions with enough lead time so an investor or business owner can actually take action and prevent serious losses: It does little good to forecast a recession once its hitting the economy over the head with brutal force.
One thing to remember is that markets tend to be forward looking – not current. By the time we see a real majority view that we are in a recession, the markets will probably have already started taking off.
Recession clearly began in December 2007. Barring a rise in oil prices beyond $150, the recession is likely to end in July. 8 months total, which is about the average length of recessions.
So it is almost over.
I can agree the recession most likely started in December 2007 but over in July? Wish I could believe that. We’re not even halfway through the downturn. Stocks will continue to fall (S&P 500 600-800), unemployment will rise, and the voters will take it out on the Republicans.