A (semi-) Positive Surprise on the trade balance
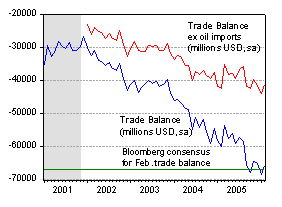
The February trade figures were released today. The $65.7 billion deficit was an upside surprise relative to the Bloomberg consensus figure of $67 billion. Bloomberg reports:
April 12 (Bloomberg) — The U.S. trade deficit shrank more in February than economists expected, to $65.7 billion, led by a decline in Chinese imports that may be temporary and do little to ease demands for sanctions.
The gap narrowed by 4.1 percent from a record $68.6 billion in January, the Commerce Department said today in Washington. Imports fell 2.3 percent and exports dropped 1.2 percent. The deficit with China was the smallest in almost a year and may reflect business shutdowns during the lunar New Year holiday.
A jump in oil costs to near-record highs and growing demand for Chinese goods suggest U.S. imports will again head higher and cause the deficit to swell. Chinese President Hu Jintao will meet President George W. Bush next week amid congressional efforts to penalize the Chinese for currency policies that lawmakers say help widen the trade gap.
The shortfall “is going to remain very large and perhaps get bigger this year,” said Jay Bryson, a global economist at Wachovia Corp. in Charlotte, North Carolina. “Part of that increase has got to come from China. This year, our deficit with China is probably going to be bigger than last year.”
The trends are depicted in the following graph:

Figure 1: Trade Balance and Non-Oil Trade Balance. Source: BEA, Feb. 2006 release.
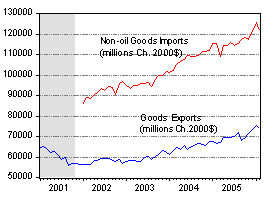
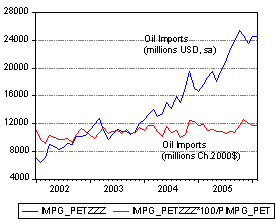
What is perhaps interesting is the trends in the real magnitudes, particularly in terms of oil and non-oil imports. Using the BLS’s end use deflators yields the following graphs.

Figure 2: Real Goods Exports and Real Non-Oil Goods Imports, in millions Ch.2000$. Sources: BEA, Feb. 2006 release, BLS Feb. 2006 release, author’s calculations.

Figure 3: Nominal and Real Oil Imports, in millions. Sources: BEA, Feb. 2006 release, BLS Feb. 2006 release, author’s calculations.
I find it interesting that non-oil goods imports declined, as did exports. Since there is much month to month variation, I wouldn’t ascribe too much to this comovement, though. On the other hand, the diverging trends in nominal versus real oil imports are definitely there. Given that oil prices have surged in March and now April, this means that despite stable quantity, oil import values are likely to continue to rise.
Technorati Tags: trade deficits,
oil imports,
oil prices
What is the deflator in Figure 3?
touche: See this BLS link, and the entry for petroleum imports.
Menzie,
If one was to look not only at Chinese but all imports during the month of February is it generally true that the number of imports shrink because:
*Imports peak during the fall season
*February has the least amount of days of any month
Judging by trade numbers from China, which showed a sharp decline in its surplus in February, followed by a sharp increase in March, the March U.S. deficit looks sure to increase, probably to at least $70 billion. Especially since other countries which have reported their trade balance for March so far, like Brazil, Chile, South Korea and Taiwan also reported increased surpluses.
Anonymous: I’ve heard this discussion about February several times, and the fall season before. I am a little surprised at these comments because these are seasonally adjusted figures that I’m reporting in this post (not all trade figures are seasonally adjusted; bilateral trade series such as that with China are not reported seasonally adjusted). Of course, the seasonality imparted to the aggregate trade series by the Chinese trade figures might not be entirely addressable by X-12 (since the Chinese lunar new year holiday moves around from month to month intermittently). To check, I ran a regression over the 2002:01-2006:02 period of the month-on-month log change of imports on a February dummy. The coefficient is -0.005, with a t-stat of about -1 (i.e., not significant). I also ran a regression of the change on a Q4 dummy to test the hypothesis of a surge in the Fall. The coefficient here was +0.0003, t-stat of about 0.10 (not significant).
Stefan Karlsson: Agreed, especially since US figures tend to overstate the level of imports from China (while Chinese statistics tend to understate).
touche:
The chained-dollar figures for oil are worthless. This is because the deflator varies by product. That is, oil is deflated more than consumer goods. Essentially, it just reiterates the total amount of oil imported in barrels.
Economists. They are so smart they outwit themselves.
vorpal: I don’t understand your points. When oil is fairly, but not completely, homogeneous, there is still some discrepancy between the real units measured by chain-weighted indices, and the physical quantities of oil (barrels). Or am I missing something metaphysical? By your argument that “the deflator varies by product” mean that the semi-conductor price index is meaningless?
Vorpal, I share your pain. Deflating something by its own price is a mistake that typically is made only by freshly minted BAs. Somebody needs to review all of Menzies publications. OMG.
touche: Still trying to understand the issue here. Please help me out. We deflate consumption by the PCE (chain index) deflator. That is an “own price”. Similarly, we deflate computer equipment by a deflator specific to computing equipment. No one seems to object to me deflating total goods imports by the chain index for total commodity imports. Now, it is true that I could have easily plotted the total number of barrels of oil coming into the country, but that treats all barrels of oil, and other petroleum products, as perfectly substitutable. Is Abu Dhabi Fateh the same as Brent, the same as Venezuelan crude? This is not a rhetorical question.
Menzie, if you deflate the price of natural gas by the natural gas deflator you get 1. You should be teaching your students the folly of this.
This shall be known as Touches rule, by the way.
Touche, you’ll have to be a little less cryptic. Yes, the price divided by the price is unity, and (price times quantity) divided by the price is the quantity. Menzie does the second– why are you talking about the first?
If you import a quantity of oil, Q, then Sales = Q*P. Menzie advocates using a deflator that is specific for the product whos value you want to deflate. we deflate computer equipment by a deflator specific to computing equipment. The more specific the deflator is to the product that you want to deflate, the closer that deflator becomes to the price of that product. So if you then deflate with that deflator, you get Sales/D = Q*P/D = Q, the quantity of that product, not the real value of that product. And if you deflate the price of that product with that deflator to obtain a real price, you compute 1. This should be highly intuitive to most people. Menzie needs to redo Figure 3.
Above posted by me.
Clarification: This site didn’t invent the chain-weighted numbers. The BEA/Census did. It’s one of the stat tables on the report. I believe the above post, simply plotted them.
touche:
I agree with your comments. Excellent.
Touche and Vorpal,
I’m still mystified by your comments. Are you saying you prefer a plot of the quantity of oil imported in units of millions of barrels, acting as though a barrel of heavy sour equals a barrel of light sweet? Are you raising a semantic point that you want “real oil imports” labelled as “quantity of oil imports”? Why do you want these things, and why do you think they are important?
Menzie should use the cpi for all items, not that for oil products, to compute the real value of oil imports. The trend of his deflated series mirrors that of barrels of oil imported, which tells you nothing about the trend of the real value of imported oil.
To get this point across, suppose you want to compute the real value of imported widgets. You have data for W, the quantity of imported widgets and P, the price of widgets. The price index of widgets is P or some constant p times P. If you compute the real value of imported widgets in 2000$ with a deflator specific to widgets, you get W*P/(p*P)*(p P2000) =W*P2000 where P2000 is the price of widgets in the year 2000. What does that series look like? It looks exactly like W multiplied by a constant, which tells you nothing about the real value of imported widgets. You should instead deflate with the CPI for all items.
I’m trying to understand this dialogue.
The CPI then, is simply a valuation of a basket of goods at a point in time using chain weighted numbers for the individual goods or the goods types. Using the “widget deflator” for each type of good may depress the increase in the cost (or conversely, depress the decrease) of the widget at that point in time. So, ultimately the CPI undervalues the increase (or decrease) of all goods in the basket. Therefore, the CPI does not accurately capture real inflation?
This is a question.
Roast, if you insist on thinking like an economist, youll end up chasing your tail forever.
Hopefully the post here will answer some questions.