Following up on Floyd Norris’s article on how slow employment growth has been during the current expansion, as well as numerous other comments on the Web, I examine other dimensions of labor market performance.
I take a cue from the White House website on the economy and employment, accessed on September 8th.
On September 1, 2006, The Government Released New Jobs Figures – 128,000 Jobs Created In August. The economy has created more than 1.7 million jobs over the past 12 months – and more than 5.7 million jobs since August 2003. Our economy has now added jobs for 36 straight months. The unemployment rate is 4.7 percent – below the average of each of the past four decades.
As a reality check, here are several indicators along different dimensions, for the current and previous expansion: (1) payroll employment; (2) civilian employment; (3) log aggregate hours worked; (4) log hours worked of all persons in the business sector.
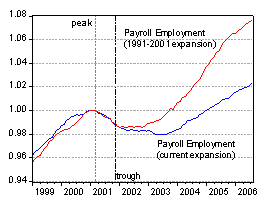
Figure 1: Payroll employment, indexed to 1 at NBER dated peaks. Source: BLS (Sep. 1), St. Louis FRED II, and NBER recession dates. (Updated 9/15 to include recession troughs.)
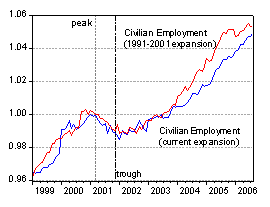
Figure 2: Civilian employment, indexed to 1 at NBER dated peaks. Source: BLS (Sep. 1), St. Louis FRED II, and NBER recession dates. (Updated 9/15 to include recession troughs.)
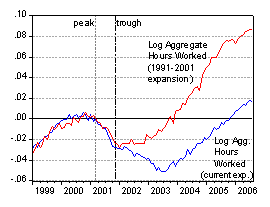
Figure 3: Log aggregate weekly hours worked, indexed to 0 at NBER dated peaks. Source: BLS (Sep. 1), St. Louis FRED II, and NBER recession dates.(Updated 9/15 to include recession troughs.)
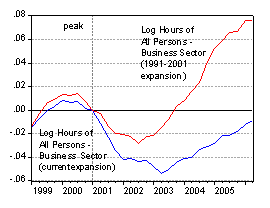
Figure 4: Log hours of all persons in business sector, indexed to 0 at NBER dated peaks. Source: BLS (Sep. 1), St. Louis FRED II, and NBER recession dates.
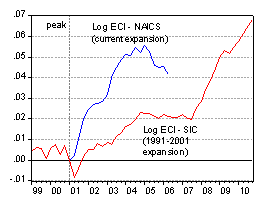
Figure 5: Log employment cost index – all workers, deflated by CPI-All Urban, indexed to 0 at NBER dated peaks. NAICS definition for current expansion, SIC definition for 1991-2001 expansion. Source: St. Louis FRED II, and NBER recession dates.
In all but one case, employment indicators are underperforming relative to what occurred at a comparable stage during the last expansion. The sole exception is real employment compensation, which is two percent higher than at a comparable stage of the last expansion. This is hardly stellar performance, especially when one recalls that the previous recovery was considered less than robust itself for the first few years after the recession trough.
In addition, the White House notes:
Manufacturing Production Has Risen 5.6 Percent Over The Past 12 Months. Manufacturing productivity has grown 3.8 percent over the past four quarters.
Here is the comparison for durables manufacturing production — something essential if a successful adjustment to a smaller trade deficit is to occur.
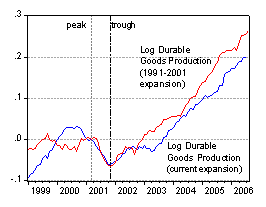
Figure 6: Log index of durable goods manufacturing, indexed to 0 at NBER dated peaks. Source: St. Louis FRED II, and NBER recession dates. (Updated 9/15 to include recession troughs.)
Technorati Tags: href=”http://www.technorati.com/tags/payroll+employment”>payroll employment,
civilian employment, hours worked, and
durable goods manufacturing
I find it interesting when employment is compared to past periods while we know that today the FED targets prosperity especially employment. If job growth reaches more than a modest level the FED will begin to attack the economy through interest rate increases and jawboning. Is it really surprising that job growth in today’s world is slower than in previous periods? Let’s hear it for the “Dismal Science.”
It is doubling disappointing considering that we’ve shoved $1.5 trillion of deficit spending into the pipe and have little to show for it. It’s sort of like coming back from Las Vegas and with your pockets empty and your credit card maxed out and realizing it wasn’t so much fun after all.
Joseph: you forgot the non-federal-budget public debt acquired, which is another $2 tril.
That would be analogous to buying the tickets to Vegas and the hotel on the credit card, I suppose.
Cheers,
Aaron
1) As usual, you are not correctly understanding or analyzing the labor force demographic changes that are underway in the US that impact employment figures. Your colleague Mr. Hamilton has pointed these out. I refer you to several posts previously on this point and elsewhere on the web (although they don’t fit with your agenda, so perhaps you are not interested)
2) As usual, you fail to acknowledge how mild the previous recession was relative to other recessions. Of course it matters if you are launching from a much higher platform.
It’s exceptionally difficult to argue that there is a non-inflationary scenario of meaningfully higher employment than we have right now.
Cheno: Thank you for enlightening me. If you are speaking of participation rates, I’m well aware of that issue. It is discussed in the wake of this post, and believe it or not I even discuss the issue of particpation rates when I teach macroeconomics (it is after all in the standard intermediate macro texts).
Regarding the launch from a higher platform, you will notice that since both the 1990-91 and 2001 recessions were 8 months long, the proportional decline in employment (either payroll or household) from peak to trough is the same. (In fact on 9/15 12:10pm, I have included the trough dates for all the monthly series to document this assertion.) Hence I think your point regarding the launch point is incorrect, at least regarding employment.
Regarding the level of employment consistent with NAIRU, I think you are operating with a simple expectations-augmented Phillips curve framework (i.e., the output gap and expected inflation are the only determinants of inflation), rather than a cost-augmented one. If the oil prices were not rising, I think this level of employment would be consistent with falling inflation.
Then why would you choose not to reference it in a discussion of labor market performance? There is obviously an important debate about participation rates, but last I checked, you haven’t done any analysis that refutes the argument that the US work force is fundamentally different than it was 15 years ago. Nor have you made a convincing case that the unemployment rate is a weaker indicator than payroll numbers or hours worked figures. It’s undeniable that you are a highly intelligent person. Your readers just ask that you use your intelligence to present a more balanced view (as your colleague Dr. Hamilton does).
Finally, has anyone done an analysis of likely employment growth in the absence of the energy shock we’ve experienced during this expansion (or conversely whether previous expansions would have been as robust applying current energy conditions)?
Cheno: Well, balance is in the eye of the beholder. I don’t think I provided much commentary associated with the pictures. The series plotted are the standard ones — payroll employment, ECI, and hours — that analysts within the government and the private sector look at.
In accord with previous discussions on this weblog you may not have participated in, I plotted as well the civilian employment level from the household series, despite the fact that there are serious difficulties with using this series over benchmarks. I would’ve plotted the “adjusted” household series modified to conform to the payroll employment concept, but that series only begins in 1994. Hence, I believe that this series of graphs of data is pretty balanced.
Finally, if you are concerned with participation rates, I think your case is strongest if one views this ratio as quasi-exogenous to the business cycle. I don’t know if I’d agree with that proposition. However, if you are interested, the civilian participation rate in August of 2006 was 66.2%; the corresponding civilian participation rate this many quarters past the trough (i.e., 128 months before August 2006) was… 66.4%. In other words, I don’t think the analysis — actually a recounting of data — is much altered by accounting for your main point.
The question seems to be why American workers seem to be so grumpy and won’t give Bush credit for his economic recovery. Bush supporters seem to think that they would see things differently if only they would look at the reams of tables and charts put out by his economists. But workers are smarter than you think. They don’t need an economist to tell them that they aren’t getting raises, their health benefits are being cut, their pensions are going away, unions are being beaten back, they have greater anxiety about losing their job, they have little leverage with their employer, there are fewer high paying jobs and they are working fewer hours. One can argue all day about the meaning of the labor participation rate and structural changes, but wage earners can feel the effects on the ground.
Productivity increases and a rising GDP mean nothing to the average worker if it all goes to the top 1%. Perhaps they are supposed to be grateful for the dubious proposition that without the tax cuts for the rich, maybe they wouldn’t have any jobs at all. Corporate profits are up and economists say that rising wages are a lagging indicator in recovery, but it’s been almost 5 years now and in this case they may lag right into the next recession.
I’m sure that Bush and his wealthy supporters are quite happy with the recovery. Just don’t expect wage earners to join in the celebration.
The unemployment rate in the previous recesion rose to 7.2 percent in 1992. The highest annual rate during the current recession/recovery period was 6.0 percent. There were only three years in the previous recession/recovery period in which the unemployment rate was lower than it is currently (1998/99/00). Those were the final three years of the expansion. A 6.0 unemployment rate fares exceptionally well against annual competitors in the last 30 years. In other words, the unemployment rate in the worst year of the last recession would have represented solid unemployment performance during many years of robust expansion in the previous 30 years.
It is amusing to see left-leaning economists torturing themselves in an attempt argue that the economy is under-performing. And it is even more amusing to press them to come up with policy recommendations that would reverse the awful reality. Crickets chirping and the sounds of tumbleweed is usually what follows.
Uh, The unemployment rate hit 7.8 in 1992, 6.3 in 2003. The economy is underperforming outside of Real Estate(well well, not for long) and Medical. Sometimes Cheno, you have to deal and you, listen to the crickets.
Cheno: I will have to tell my students I’m left-leaning. They will be highly amused.