How surprising?
The BEA/Census released the July trade figures this morning. The actual $68.0 billion deficit for July (seasonally adjusted figure) was substantially larger than consensus of $66.0 billion. Consequently, the release was, in contrast to the June figures “big news”. Here’s Bloomberg’s coverage:
The U.S. trade deficit unexpectedly surged to a record in July as an increase in imports signaled American consumers will keep the economy expanding.
Imports exceeded exports by $68 billion, the Commerce Department said in Washington, up from $64.8 billion in June. The gap exceeded estimates by all but one of the 69 economists surveyed by Bloomberg News before the report.
A growing appetite for Japanese electronics and clothing from China suggests American consumers are still spending even as the housing market sags, and that the U.S. economy needn’t rely on foreign demand to fuel the expansion. Exports dropped 1 percent in July, partly because of a fall in aircraft sales.
“We have a slower growing economy, but it’s still reasonably healthy and still drawing in a lot of imports,” said Ethan Harris, chief U.S. economist at Lehman Brothers Holdings Inc. in New York. “While the U.S. economy has slowed, it hasn’t cratered.”
The July deficit compares with the $65.5 billion median estimate in a Bloomberg News survey. Forecasts ranged from $60.5 billion to $70 billion.
The deficit adjusted for changes in prices, figures the government uses in its calculation of gross domestic product, widened in July to $59.1 billion, the highest since January. The increase suggests the nation’s worsening trade balance will restrain economic growth this quarter.
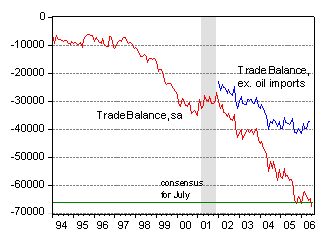
Below is a graphical depiction of the time series, in millions of dollars.

Figure 1: Total goods and services trade balance and total ex petroleum and petroleum products imports, seasonally adjusted. Source: BEA/Census, July 2006 release.
One noteworthy point is that the non-oil trade deficit has continued its stabilization in nominal terms (as mentioned in my post on the May 2006 trade figures as well as this post based on the NIPA data), so in terms relative to GDP, it has fallen.
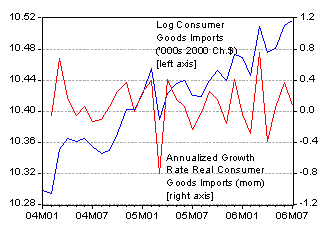
The article cites the continued strength of the consumer. The month-on-month figures don’t support that contention — although the quarter-on-quarter growth rates would indicate some growth.

Figure 2: Imports of consumer goods, in ‘000s of Ch.2000$ (blue line), and annualized growth rates (red line). Source: BEA/Census, July 2006 release.
Returning to the overall trends exhibited by the difference between the total and ex oil trade balance, it looks to me like the July trde balance was once again driven by oil prices; since August prices were similar to July’s, look for a repeat in this category in the next trade release.
Brad Setser puts these figures in broader context, while Calculated Risk discusses the slowdown in exports.
Technorati Tags: trade deficits, consumer goods imports, oil imports, oil prices