This seems like a good time to review some of the occasions over the last year when I’ve been brave (or foolish) enough to make a specific quantitative prediction.
December 8, 2005.
Only 17 more (oil) shopping days until December 31.
Let me for my part point out that there is an alternative to the positions of the fiercest bulls and bears, which is that oil may be priced correctly about where it is right now. The basic reality that drove prices so high this year was the need to reconcile booming world demand with limited short-run ability to increase production and also to establish a current price consistent with the future depletion concerns…. Sixty dollars a barrel seems to have accomplished its mission.
May 7, 2006.
Have oil prices peaked?
Since concerns about a further move up in price have been well represented, I thought there might be some value in trying to provide some balance by calling attention to a few of the possibilities on the downside.
May 17, 2006.
Stagflation.
I’ll throw my hat in the ring by predicting another hike in the fed funds rate to 5.25% at the end of June.
August 4, 2006.
A pause it shall be.
The big question over the last month has been whether the Fed would opt for yet another hike at next Tuesday’s meeting…. the BLS release seems to have settled the argument, as least as far as the CBOT Fed watchers are concerned.
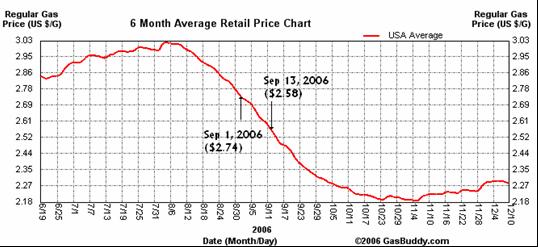
September 1, 2006.
Gasoline prices coming down.
U.S. gasoline prices have been dropping and will likely fall further….another 30-cent-per-gallon drop to $2.50 is quite reasonable to predict.
September 13, 2006.
Gasoline prices will fall even more.
a retail gasoline price below $2.20 a gallon appears to be quite reasonable to anticipate.
October 26, 2006.
More evidence that housing may be stabilizing.
Data on new home sales and inventories released today from the Census Bureau continue to support the view that the market downturn may have reached its bottom.
Ah, that last one will give us something fun to watch for in 2007, won’t it?
Not a bad record. How about something on the 5th race Tuesday at Santa Anita?
Does your quantitative predictions ability showed in this blog reflect your econometric modelling capacity or is it more related to the intution gained with your expirience in these markets?
Sam, usually what makes me bold enough to issue a forecast is when prediction markets, my own understanding of fundamentals, and any statistical analysis I may have done all give the same answer.
Next years predictions? Rising oil prices? Cut in rates? Bottoming of housing?
You don’t think I should quit while I’m ahead, Lord?
Ok, kudos to you James. We wouldn’t be here if we thought you were just lucky (as per Joseph…maybe sam too with that “intuition” talk…could be Lord thinks these were too short-sighted calls…Jiminney this is looking like a tough crowd!)
Even if you are occasionally wrong, this too, is instructive.
The final prediction is problematic. “The market downturn” is vague enough to leave room for quibbling. Starts, sales, completions, prices? The market includes all of these, but they need not behave in similar manner over the period of a few months.
I predict…
Completions won’t trough until 4 to 8 months after starts.
Bold, no?
kharris, the call, for what it’s worth, was for seasonally adjusted new home sales, the series plotted.
Isn’t that akin to accessing out-of-sample accuracy only with one point.
A good test for out-of-sample accuracy, the only one I know would be to trade your ideas.
So you can predict oil prices turning points(actually one point: this year). How about showing us an equity line corresponding to trading this “oil turning point” model over lets say 4 years.(I am not even sure that will be enough point for a test of out-of-sample accuracy.)
I just thought those were reasonable predictions for next year.
I think that I should employ JDH in my money management business!