The non-oil trade balance stabilizes. Petroleum-related imports exceed the US-China trade deficit.
The BEA/Census released the October trade figures this morning. The actual $58.9 billion deficit for October (seasonally adjusted figure) was substantially smaller in absolute value than consensus of $63.0 billion. The decline was hence a big surprise. Here’s Bloomberg’s coverage:
“The U.S. trade deficit shrank by the most in almost five years in October as the price of imported oil dropped and faster growth abroad propelled exports to a record.
The Commerce Department said today in Washington that the gap narrowed 8.4 percent to $58.9 billion, less than forecast by economists. The improvement came even as the U.S. had a record shortfall with China, which is on course to surpass Mexico this year as the nation’s second-biggest trading partner behind Canada.”
Below is a graphical depiction of the time series, in millions of dollars.
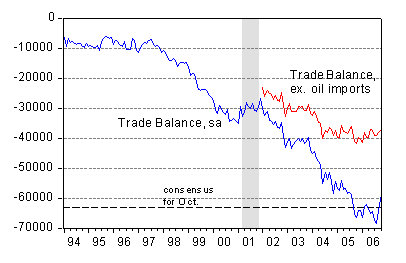
Figure 1: Total goods and services trade balance and total ex petroleum and petroleum products imports, seasonally adjusted. Source: BEA/Census, October 2006 release.
One noteworthy point is that the non-oil trade deficit has continued its stabilization in nominal terms (as mentioned in my post on the May 2006 trade figures as well as this post based on the NIPA data), so in terms relative to nominal GDP, it has fallen.
The article continues:
“The trade deficit with China rose to $24.4 billion, from $23 billion in September. Imports from China rose to $29.3 billion in October. U.S. exports to the country rose to $4.9 billion from $4.6 billion. Year to date, total trade with China reached $281 billion, passing Mexico’s $278.3 billion.
Paulson, Fed Chairman Ben S. Bernanke and Commerce Secretary Carlos Gutierrez are among a group of U.S. officials going to China this week in what will become an ongoing effort to address differences. The U.S. is China’s biggest trading partner.
U.S. congressional leaders and manufacturers have criticized China for keeping its currency, the yuan, undervalued in order to promote sales overseas. They’ve also said the country has failed to crack down on rampant piracy and has kept some industries closed to overseas competition.”
While all eyes are on China, with the impending visit by Secretary Paulson et al., in some ways we should (as Brad Setser and others observe) be focusing are sights elsewhere. In particular, despite the decline in petroleum-related imports associated with the decline in oil prices, oil imports are now of equal value to the bilateral trade deficit with China.
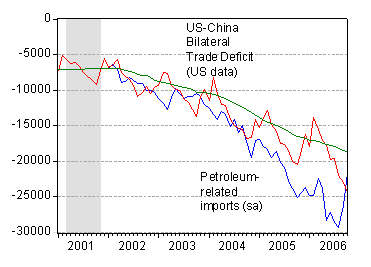
Figure 2: Negative of imports of petroleum related goods, seasonally adjusted (blue line), and US-China bilateral trade deficit(red line, 12 month moving average green). Source: BEA/Census, October 2006 release, BEA/Census data via Haver, and author’s calculations.
Because of the seasonality in the bilateral trade data, it makes sense to put heavier weight on the 12-month trailing moving average series (green). Two observations:
- The value of oil imports is declining, but this is almost entirely due to the decline in oil prices. This is shown in Figure 3 below. (West Texas Intermediate is used as a proxy for world price of oil). Hence, a resurgence in oil prices would reverse the improvement in the deficit.
- Real petroleum related imports are declinining slightly in the last couple of months. In fact, they are about at the same level as October of 2004, which is remarkable given the fact that real GDP is probably around 6.5 percentage points greater. This may indicate that higher energy prices have induced reduced quantity demanded, or the deceleration in growth has reduced demand (the distinction is between a movement along, and a shift in, the oil demand curve).
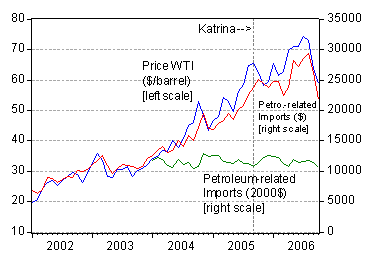
Figure 3: Price of West Texas Intermediate (blue line), imports of petroleum related goods, seasonally adjusted (red line), and real imports of petroleum related goods in 2000Ch.$(green line). Source: BEA/Census, October 2006 release, St. Louis Fed FREDII, and author’s calculations.
One last observation regarding the US-China trade deficit. As remarked in a previous post, there are measurement problems associated with how the US attributes imports from Hong Kong, and how China attributes exports to Hong Kong. These are discussed in my other post on US-China trade. But there is a more fundamental issue of measurement — that is in the case of China, imports from China into the US are very likely to differ very substantially from value-added imported from China, exactly because of the integrated supply chain nature of production. Figure 4 from Lum, CRS Report RL31403
Aug. 2006 illustrates the fact that imports from East Asia account for roughly the same share (35%) of total imports in 2005 as it did in 1990.
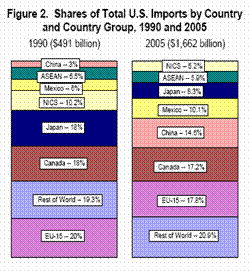
Figure 4: Figure 2 from Lum, CRS Report RL31403 Aug. 2006.
So in some sense, given the integrated nature of supply chain production in East Asia, China (on its own) looms smaller than the oil exporting countries.
[Late Addition: 12/14:]
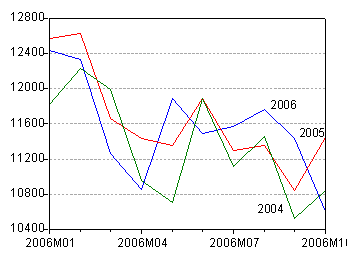
Figure 5: Imports of petroleum related goods in 2000Ch.$, seasonally adjusted (blue line), lagged one year (red line) and lagged 2 years (green line). Source: BEA/Census, October 2006 release and author’s calculations.
Technorati Tags: trade deficits,
China,
oil imports,
oil prices
Menzie — great post as usual. one small quibble — I am not a big fan of the imports from asia as a pecentage of total imports metric: imports have gone up substantially as a share of GDP since then, so imports from Asia have gone up substantially as a share of GDP and commodity prices have also gone up since then (as have oil import volumes), so it is in some sense impressive that despite shifts in the terms of trade that have increased the $ value of US commodity imports, exports from Asia have kept up).
I think we should be paying a lot more attention to the role the shifting oil balance has played in the US trade balance, in no small part because it is something that we in the US can influence with our own policy choices.
But I wouldn’t downplay Asia/ China — the US bilateral deficits with Canada and Europe look to be heading down, but not the US bilateral deficit with Asia. and if you look at the global data, the story is more or less the same — Asia’s current account surplus is still trending up, driven by China’s rapidly growing surplus. Jon Anderson of UBS just esimated China’s global surplus would top 10% of its GDP in h2 06 … that’s big, by any measure.
The notion that Paulson and B-B-B-Bennie of the Feds ought to go visit Arab oil exporters and get them to float their currencies instead of China is becoming popular, but I must quash it at once [foot stomping noises in the background].
Granted, oil exporters may be running larger CA surpluses at this point in time. However, the obvious political angle missed out in the “why-don’t-these-boys-visit-the-Middle-East” school of thought is that American and Chinese exports compete more directly with each other than do American and GCC exports–which are basically just fuel.
Hence, China is purportedly not “playing fair” by disregarding IP laws and flouting environmental and labor standards to “steal” American jobs–particularly in manufacturing. In the name of freedom, justice, and Guantanamo Ghraib, their foul behavior must cease immediately 😉
This caught my attention:
Real petroleum related imports are declining slightly in the last couple of months. In fact, they are about at the same level as October of 2004, which is remarkable given the fact that real GDP is probably around 6.5 percentage points greater. This may indicate that higher energy prices have induced reduced quantity demanded, or the deceleration in growth has reduced demand (the distinction is between a movement along, and a shift in, the oil demand curve). Why is it so hard for me to believe that people have started taking the bus or bicycle or walking? No, it’s too early for that. 6.5% greater GDP and yet the same amount of petroleum imports…shoot, it’s gotta be a lagging factor, the reserve tanks are (6.5%) lower and will be filled up next month/quarter bringing strained credibility (not just mine) back to this stage.
Last slightly disturbing thing: I see a similar uptick in Fig 1. Trade Balance, just before that vertical bar ~00-01 demarcating the recession…maybe just a coincidence.
I don’t see much cause for cheering.
As far as oil goes, we appear to be in a yearly trough of a cycle of wild swings in price (always ending higher) that have become persistent in the past few years.
The greater share of US exports, helping the balance of trade, isn’t much of a surprise either. Dollar falls, US exports rise. Easy.
The structural situation seems to be continuing.
Looking again a little harder at the BEA release and those petroleum numbers which show that a whack (you don’t need to to this revisable number people) less was spent in 06 Oct ($18,760M) than in the previous month ($22,632M) roughly $4B or the $5B improvement trade picture, yes?
Oil has come down in price somewhat, but not 20%, certainly not at the pumps I visit. So it appears that Menzie might be right: less bls of oil were imported. Does this just happen at this time of the year? Not last year where $ amounts of Oct oil exceded $ amounts of Sept oil (Do I have prices/bl at my finger tips for these dates? no, this is recreation not crime and punishment.)
I have reached my ‘preliminary’ position (a slight advance on my former ‘advance’ guess): we bought less oil last month giving the impression of an improving trade picture, soon to be dashed when we resume our normal petroleum purchasing habits, probably starting next month.
Too much is made of the effect of a debased currency on exports. Trade and manufacturing have a much greater influence.
If you look at the balance of payments you will find that prosperous countries almost always have a negative balance of payments as they export paper currency to import real assets, wealth. This can be seen in trade balances in the earlier centuries as well. England at the height of its prosperity had a negative balance of payments.
The decline in the non-oil imports is another indicator that we are in the beginning of an economic slowdown.
Brad Setser: As usual we agree on lots of points. I do agree that in light of changes in relative prices, the increase in East Asian exports to the US is surprising. However, my main point was to highlight the fact that we shouldn’t focus on China per se, but rather East Asia in general. What it does largely (but not only) re-allocates the total US deficit between America’s trading partners.
On the issue of oil importts, I agree we should be focusing on that to a greater degree, although what can be done over the short term is unclear.
Emmanuel: I’m all for trying to get China to live up to the letter and spirit of its WTO commitments. But we shouldn’t jump to the conclusion that if they were, the US trade deficit would shrink substantially; the US-China deficit would largely be re-allocated to other low cost producers.
Calmo: I didn’t include a graph of real imports and real imports lagged 12 and 24 months. The comparison with one-year-ago is problematic due to the distortions associated with Hurricane Katrina knocking out Gulf production; two years ago imports were indeed rising into October. One oddity I remarked upon in an earlier post is that these are supposedly seasonally adjusted figures.
Aaron Krowne: I agree with most points except that regarding the dollar. For most of the past year, the broad trade weighted dollar has been trending sideways. The most recent decline in the dollar is too recent to have worked its way into exports. I think the standard explanation that faster growth in Europe has driven exports is more likely to be correct.
DickF: I am impressed by your dediction to resurrecting the Hume price-specie-flow mechanism. Good luck.
Thanks Menzie. Yes, I have never been able to accept merchantilism in any garb.
Calmo,
No need to guess about oil prices and volumes. They are teased apart in the data. Oil prices were reported down 11.3% in October vs September ($55.47/bbl vs $62.52). Barrels imported were off 1.5% at 311.758 mln.
MC,
I’d guess we’ll want to add one more factor in figuring out why imports have dropped. Inventories are high. All else equal, as inventories get fuller, import volumes will fall.
Thanks kharris. So ~$4B less spent on Oil largely due to cheaper prices, prices that aren’t so obviously 11.3% cheaper at the pump.
And ‘appreciate that note about falling imports due to significant inventories, suggesting to me some softening in the demand picture.
I bet Ford is just waiting to see that note about rising inventories mean…imports will fall. Meanwhile back to drafting up $24B worth of financing to restructure for a leaner, meaner…
Would trade be facilitated if we only had one currency used in international trade?
Calmo and kharris: I’ve added a Figure 5 to show you the pattern of oil imports over the last few years.
DickF: Yes, a single currency for world trade would facilitate trade. See work by Jeffrey Frankel and Andy Rose on the subject. Of course, that path would not be costless; the price adjustment mechanism afforded by floating exchange rates would be short-circuited.
Thanks Menzie. Mundell received the Nobel Prize primarily for his work on currency areas. He talks of three currency areas Europe, Western Hemisphere, and Far East, but I think he would say that the optimal currency area would be the whole world.
You may know that I believe that the “price adjustment mechanism” destroys wealth by changing the terms of trade but that is another discussion.
Thanks for the new chart, Menzie. The EIA weekly report
http://www.eia.doe.gov/pub/oil_gas/petroleum/data_publications/weekly_petroleum_status_report/current/pdf/wpsrall.pdf
shows inventories out of their 5-year range for much of the year. The divergence is coming down, just as oil imports come down (in your chart) vs year ago. I don’t want to engage in too much data mining, but the pullback in excess inventories seems to have started toward the end of the hurricane season. We may be seeing the effects of prudence and then relief in petroleum inventory management.
Was the increased use of fuel additives, like Ethanol, taken into account as a reason for the flat oil imports from 2004 to 2006.