GDP growth was revised up in today’s NIPA release. But there are some interesting aspects in the details.
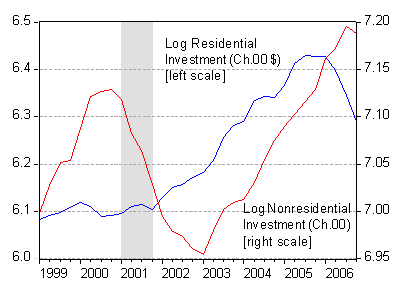
Nonresidential investment spending was revised downward, reinforcing the view that output growth will decelerate in the near future, even as the residential investment collapses further (see [1],[2], Calculated Risk).

Figure 1: Residential (blue) and nonresidential (red) investment, in billion Ch.2000$, SAAR. Source: BEA NIPA release of 29 March 2007, and author’s calculations.
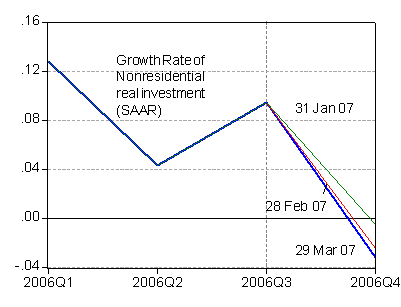
What is interesting to me is the evolution of the estimated nonresidential spending. It’s all downward from advance to preliminary to final.

Figure 2: Quarterly nonresidential investment growth (in log differences), SAAR, from March 29 (blue), February 28 (red) and January 31 (green). Source: BEA NIPA release of 29 March 2007.
Technorati Tags: recession, investment,
residential investment.
So the next few quarters don’t look too rosy, but that does not deter Blackstone from its IPO I see. (No, probably moved the date up, I bet.)
Of that modest GDP growth of 2.5% we have an immodest contribution from PCE of 2.93% (~120% of GDP growth!) which was negated almost entirely by a retreat in private domestic investment of 2.71%.
It wasn’t the auto sector that consumers were patronizing which only subtracted 0.15% from that GDP (surely this is the biggest revision from the advance numbers).
It was…household furniture (!!!) adding .38% and other non-durables (I jest) [1.18% –of which more than half was food.]
I’m waiting for another revision, not only so my first guestimate (of zero) looks better but also, because the q1 2007 ‘advance’ has to bounce off of a lower benchmark than 2.5%.
calmo,
You may get your wish – I’m projecting 2007-Q1 will come in at 2.2% (at the final revision – not the advance release that will come out next month!)
I see from the Table A that autos removed 1.3 from that final 2.5 GDP stat –not as I stated above going from Table 2.–Contributions to Percent Change in Real Gross Domestic Product [Quarters seasonally adjusted at annual rates]
…and fess up to not knowing how to interpret them as I once thought I had understood these numbers esp in light of 2005q3-q4 similar auto distress.
No, I think these are just plain errors.
Why do all the typos have to be mine?
This B a NIPA typo.