Dave Altig ([1],[2]) is your source for wisdom about the latest retail sales figures.
From MarketWatch:
U.S. retail sales unexpectedly fell 0.2% in April, government figures showed Friday, raising worries that a pillar of strength in the economy– consumer spending– may be shaky. This marked the biggest decline in retail sales since last September. Excluding automobiles, retail sales were flat. Read full government report. Economists had been expecting a soft April sales report, but not one this weak. The average forecast in a MarketWatch survey called for a 0.3% rise in retail sales in April.
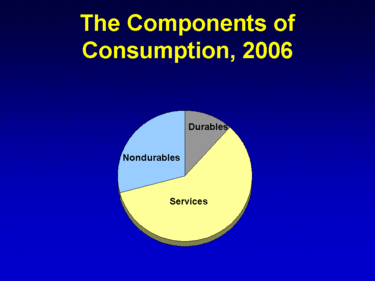
To put this in perspective, Dave the Sage notes first that retail sales are not to be confused with the consumption component of GDP. The biggest chunk of the latter is services, which are not included in retail sales:
 |
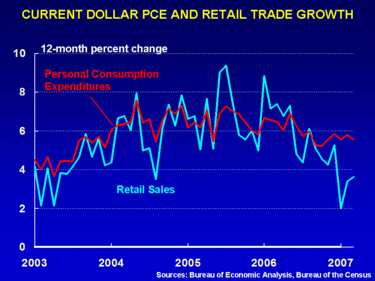
Second, we’d already seen evidence that retail sales have been diverging south of total consumption spending:
 |
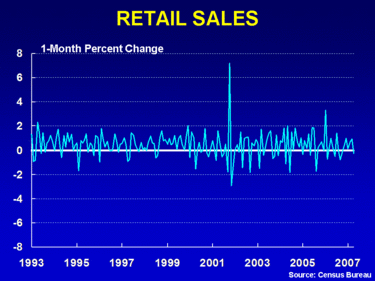
Yes, the April retail sales were distinctly worse than recent months. But if that rings your panic alarm, you’d be a nervous wreck:
 |
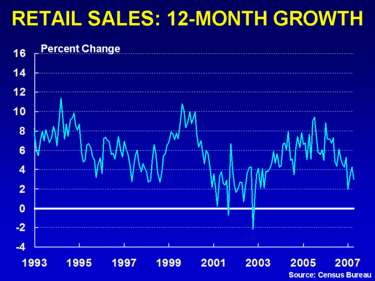
None of which is to deny that the broader trend is one of softening:
 |
So, if you thought we were going to see 3% real GDP growth in 2007:Q2, this would knock you off your high horse. But if you thought we were going to limp through with weak but positive growth, this is all quite consistent with that picture. Taken by itself, granted, the April retail sales figure constitutes another negative. As did the April employment numbers.
But then again, the March employment numbers had sent an equally strong bullish signal. And if your economic call changes each month like the third graph shown here, well, then each month you’ll always have something interesting to say.
And so does Dave, but in a less surprising sort of way.
Technorati Tags: macroeconomics,
retail sales,
recession
I thought this was another interesting take on the retail sales here.
What? Me, worry?
Thanks for that link Steve.
I mulled over the bifurcated nature of CPI at macroblog and still wonder if it’s possible that hi-end consumers can make the picture look brighter than it really is…until maybe lettuce gets to $5/head…food costs being so volatile it makes no sense to track that item…esp when so many of us need to go on diets.
So one customer buys a Lexus (yeah I know that’s not a core CPI component) while 10,000 folks decline the $5 lettuce (see? another non-component so we’re even) and the CPI remains unchanged (neither item counted officially) but the economic activity (that preference, those declined purchases) could be worth noticing esp if those lettuce hungry folks start acting out, you know?
Suggesting the view that the consumption habits of the general population should be measured and recorded with that increasing disparity in wealth in view. I know the weightings do change somewhat but how exactly?
Professor, what thoughts do you have on the housing (14% of PCE) and medical care (16% of PCE) components of PCEs? Is housing via ‘owners equivalent rent’? If yes, owners equivalent rent seems a shaky, subjective assessment to my layman’s eyes. And, it seems to never go down, quarter to quarter (or, only infrequently, in Q3 and Q4 ’02) (looking at real, not nominal, data).
And, medical care is an odd series: it never goes down, quarter to quarter (or, only once in a blue moon, as did in Q2 ’93); must be because of the government financing component.
I dunno. The government constructed (if housing is OER) and government financed series seem odd, and immune to ordinary economic forces, unlike the durable and non-durable goods series.
Sorry Steve, but that numbskull is a retard.
Those numbers he spouted WERE NOT impressive for March, nor was April ‘starting out ok”. Intial government numbers are a waste of time.
I sent him a email and bombed the living hell out of him.
Nothing personally Steve, but that guy is spinning.
We cannot tolerate “fair” consumer spending. It must be strong or the economy won’t grow. That is why we are staring a 0% growth rate in the 2nd quarter right in the face.
Heck, during the 00-03 Stock Market trough, consumer spending stayed at a “fair” range instead of tanking like ECRI’s of the world said it would.
When debt servicing overwhelms everything, the consumer tanks, everything tanks.
This expansion is like a Star going Red Giant. We all know what happens after that.
Gotta agree with dryfly and Johnson. I am baffled by Brusca’s comment about spending getting stronger as Q1 progressed. Real personal spending in March fell 0.2%, after rising 0.3% in February and 0.4% in January. Looks to me like PCE was progressively weaker, and that relative to the average, March was softer than it would have been if spending had grown steadily through the quarter. If you take the 6-month average monthly gain in PCE and extend it through Q2, you get a smaller GDP contribution from PCE in Q2 than in Q1, just as you got a smaller contribution in Q1 than in Q4. Given that the retail sales data suggest a slower than average month for real PCE in April, pushing average PCE growth through Q2 is generous. PCE is, so far, looking like a smaller contribution to GDP in Q2 than in most recent quarters. Still time to fix that, but it’s an up-hill battle.
kharris,
He’s talking about retail sales; you’re talking about total PCE.
The fall in real spending in March was due to a decline in spending on services. January retail sales were flat from December, February was up .6% from January, and March was up 1% from February.
This should help here
If you look at the table at the bottom, you can see that real service spending was up .5 and .6 in January and February respectively. In March, real service spending was -.3.