The March trade figures are in at BEA, and many are surprised. Bloomberg reports:
U.S. Economy: Trade Deficit Widens More Than Forecast (Update3)
By Joe Richter
May 10 (Bloomberg) — The U.S. trade deficit widened more than forecast in March as higher oil shipments drove the biggest increase in imports in more than four years.
The deficit rose 10.4 percent to $63.9 billion, the Commerce Department said today in Washington. Imports and exports were the second highest on record. Climbing fuel costs also pushed the price of foreign goods higher for a third month in April, the Labor Department reported separately.
The U.S. imports two-thirds of its oil and the biggest rise in crude prices since June is offsetting the benefit to U.S. exports from a weaker dollar. A more competitive exchange rate and expanding economies in Europe and Asia have trimmed the deficit from a record $68.9 billion in August.
“We were paying sharply more in March for imported oil, and frankly that’s only going to contribute to a lot more red ink in April,” said Stuart Hoffman, chief economist at PNC Financial Services Group in Pittsburgh.
The trade shortfall with China narrowed to $17.2 billion in March from $18.4 billion a month earlier. Imports from China were the lowest since May 2006 while exports were a record.
…
The current data and the February release are depicted in Figure 1. In black is the trailing 3 month moving average.
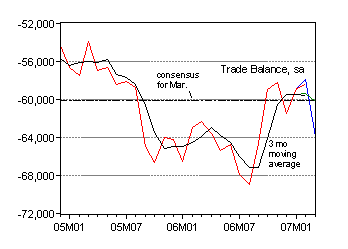
Figure 1: Trade Balance, March (blue) and February (red), and three month trailing moving average (black), and Bloomberg Consensus (black dashed line), in millions of dollars per month, seasonally adjusted. Source: BEA/Census March 9th trade release; Bloomberg.com, and author’s calculations.
As the figure shows, there was good news in the revision of February figures — the trade deficit was smaller. On the other hand, the March figures were far below the consensus figure of -$60.1 billion.
While the commentary is focused on the impact of oil imports, I think it’s of interest to note that the trade balance ex. oil imports also deteriorated.
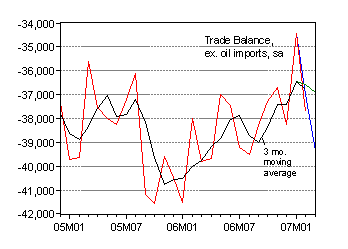
Figure 2: Trade Balance ex. oil imports, March (blue) and February (red), and three month trailing moving average (black), in millions of dollars per month, seasonally adjusted. Source: BEA/Census March 9th trade release; Bloomberg.com, and author’s calculations.
I might observe that the trade balance is one of the wild cards in the expected revision of the GDP numbers going from the advance to the preliminary 07Q1 release. At the time, some analysts argued that the GDP numbers would be revised upward because of strong GDP growth abroad would suggest a surge in exports. As it was, nominal exports of goods and services did grow 21% on a annualized m/m basis (log terms). But nominal imports ex. oil grew by 33% (the total grew by 53%). Things look better on a 3 month change basis. Then it’s nominal exports by 3%, non-oil imports by 4.9%, and nominal total imports by 7.2%. Still, over the first quarter of 2007, imports by any measure are increasing faster in nominal terms than exports.
Of course, it’s real export and import growth that matters for real GDP growth. According to BLS April import/export price release, prices of goods imports (ex. oil) rose 0.3% in March, while goods export prices rose 0.6%. This suggests quantities of goods (ex. oil) imports in March definitely rose faster than quantities of goods exports. This suggests to me — with the caveat that I haven’t done the deflation for the entire quarter’s worth of exports and imports — that new trade figures are unlikely to indicate an upward revision of GDP (except to the extent that strong import growth is correlated with domestic demand, in ways that were not already captured in the indicators BEA uses to estimate domestic demand components).
Late Addition, (1pm Pacific): Nouriel Roubini writes:
Based on a variety of data that have come out after the first estimate of Q1 US growth at 1.3% it is now likely that US growth in Q1 was actually below 1% (probably close to 0.7%); we are thus already into a “growth recession” territory. As discussed extensively in this blog a US hard landing can take two forms: a “growth recession” i.e. a period of time when growth is well below potential and in the 0% to 1% range; or an outright recession, i.e. two consecutive quarters of zero growth.
…
The net effect of these three factors is an estimated 0.7% growth for Q1 (JP Morgan today revised its Q1 estimate downward to 0.8%).
Much more seriously, Q2 started on a very weak note for private consumption based on initial estimates of retail sales. I now expect Q2 growth to be closer to 0% or even negative (i.e an outright recession).
Robert Brusca at Haver.com takes a slightly different view on the impact of the trade figures. In “U.S. Trade Gap Widens on Oil and Without Oil”, he writes:
The SURGE in the March trade deficit (-$63.9 from –$57.9) will chip a bit more off of already weak GDP growth — but not as much as some may think…
That monthly result is a nominal -$72bil worsening in the month at an annual rate… that, in turn, is one third of the quarter so that result worsens the quarter by $24bil more at an annual rate in nominal terms. It could shave another 0.2% to 0.3% off GDP’s already weak growth rate. The subtraction from GDP might have been worse except that much of the import surge is in oil and it is due to PRICE; that blunts the impact of the trade widening on REAL GDP. Both exports and imports show strong growth in the month and that is a PRO-GROWTH sign for the economy. Much of the surge in the trade gap this month is in petroleum and products where imports rose by 17% (m/m) in March. The Non-Oil deficit worsened by only $1.2bil in the month or $0.4bil for the quarter that is less than $5bil annualized, in nominal terms… And that is why the likely subtraction from GDP due to trade does not worsen by much more than a few decimal points.
Technorati Tags: imports,
trade deficit,
exports,
oil imports,
GDP.
Yep, I agree Professor, there may not be an upward revision in Q1 GDP. I may yet prove incorrect in my prediction of Q1 GDP growth of 1.0%.
There’s still an opportunity for you and Professor Hamilton to beat the rush and move the emoticon to frown, today! Given the retailers reports today, tomorrow’s retail sales report tomorrow should be lousy.
More importantly, there’s still time to short this expensive market. The correction may not come tomorrow. But, it’s coming, and soon.
… the biggest rise in crude prices since June is offsetting the benefit to U.S. exports from a weaker dollar.
Does anyone see any connection between higher oil prices and a weaker dollar? Is this really a surprise since oil is denominated in dollars? I would be surprised if this were not true. I am surprised over and over that some believe that a weaker dollar will generate sufficient exports to offset the loss of wealth the debasement causes.
Tables 10 & 11 of the release provide the real data.
The real trade deficit was:
dec..58,977
jan..57,736
feb..57,730
mar..60,707
Since in the gdp account the important number is the change from Dec. to Mar. It is fairly obvious that the 1st Q real gdp number should be reduced by new data– although the bea probably assumed that the March data would be bad, but not this bad.
jg: Yes, you may very well prove right. See the additional material, quoting from Roubini and from Brusca at Haver in my post.
spencer: Thanks for reminding me the chained series are in those tables. I checked the nominal figures earlier on, and the BEA seemed to be working off the average of the first two months trade data to get the quarterly rates. If that is true, then you’re right that BEA was not guessing the trade data for March would be this bad.
GDP is tracking at 0.7% after today’s data; look for the media to start talking about the “r-word” a lot more in the coming weeks. Whether is not it actually happens is a totally different matter.
I keep seeing signs of inflationary pressure in the necessities not just here, in the States, but elsewhere. One bizarre article I read this morning described how the price of mayonnaise in Japan is going up because they use soy oil which is increasing in price because mid-west American farms are planting more corn for ethanol production. In a more straightforward example, the cost of drinking ethanol and beef (Japanese) is driven directly by the corn diversion. Of course, if the price of gasoline was lower or ethanol was likewise taxed in all States, there would be no business case for bio-fuel. So, worldwide oil consumption versus production is directly, not indirectly, driving the cost of food. Does this mean food and energy are now interchangeable? How much rum could Brazillians produce, or how many millions of starving children could get hyper off candy if oil demand drops and pinches the bio-fuel market?
[rant]How very American it is to drive world-wide food inflation, a critical necessity, with our large displacement vehicles and suburban lifestyle. It’s really awesome how widespread the effects of a minor energy cost increase ripples throughout our economy and can effect fundamental lifestyle changes. I never get tired of seeing connections between seemingly unrelated topics.
GW and the mid-west farmer’s push to subsidize our crude oil consumption with bio-fuels could cause inflation around the world while we dream of our next big sporty gas guzzler and moving into better homes farther from work. If that’s not a free market, I don’t know what is.
The Government and mass media like to talk about “big industry” and carbon emissions but that same big industry is actually pretty efficient at adding to the GDP. I, in my 4-banger, add nothing to the GDP and plenty to the air while driving. Appropriately promoting public transportation by using proceeds from an increased gasoline tax could do more for global warming than any alarmist movie or heavy-handed government intervention ever could.[/rant]
Just wondering what Menzie and JDH have to say about David Malpass, the chief economist for Bear Stearns:
We expect more U.S. growth, profits, inflation and equity price gains than the consensus, and rate hikes rather than cuts.
We expect the reflation trends, dating from the U.S. shift to a low real interest rate policy in 2002, to continue for now, pushing prices up in most asset classes. We think there will be an inflection point when the Fed finally takes the punch bowl away, but the low core inflation reading for March further delays tightening.
Globally, the impact of plentiful liquidity is reaching a crescendo, with stocks high, spreads narrow, growth strong, land prices booming and central banks flooded with dollars. We note the sharp contrast with 2001, when a shortage of dollar liquidity (strong and strengthening dollar, high real interest rates, low central bank dollar reserves, falling gold and commodity prices, rapidly shrinking U.S. profits) all spelled weakness.
The May 10 Bank of England 25-basis-point rate hike to 5.5%, topping the U.S., gives an opportunity to benchmark U.S. monetary stimulus. The global monetary excess is building up in dollars, not pounds–in petro-dollars, dollar-holdings at foreign central banks and under-invested dollar balances at corporations. The BOE, with a strong pound and a mortgage market that is almost entirely floating rate, is expected to go higher still, showing the Fed stimulative by contrast.
We think there is a continuing underestimate of U.S. conditions and sturdiness. The May 10 releases of a low 297,000 in initial jobless claims and a $178 billion U.S. budget surplus for April, a full $33 billion above the Bloomberg consensus, show a stronger economy than the preliminary April jobs report and the first quarter GDP estimate.
We expect consumption growth to remain relatively steady, though not as fast as the first quarter’s 3.8% real PCE growth. The consumer has plowed easily through the previous front-page slowdown stories–the negative wealth effect from Nasdaq’s decline in 2000, the end of tax rebates in 2003, the low savings rate in 2004, gasoline prices in 2005, the negative wealth effect from house price weakness in 2006, the slump in mortgage equity withdrawals in 2006.
U.S. GDP growth fourth-over-fourth was a fast 3.1% in both 2005 and 2006, despite constant talk of a consumer slowdown, Katrina and then the house-building correction. The consumer’s biggest asset is good lifetime after-tax earnings prospects, not home equity or savings or low gasoline prices. At 4.5%, unemployment is well below last year’s consensus expectations, causing an improved consumer outlook. Despite the misleading personal savings rate (negative because it arbitrarily excludes gains from income), the U.S. has more household financial savings than the rest of the world combined, an even bigger lead if tangible assets like houses and cars are counted.
Regarding the weak retail sales in April, we note that: A. Retailing is declining as a percentage of overall consumption, so it’s not as important to GDP. Retailing excludes most services, which are growing. B. Retailing includes the weakness in building materials which are counted in GDP as residential investment, not consumption. So some of the weakness in retailing is double-counting the weakness in housing. C. Consumption grew a very strong 3.8% in Q1, so we expect something less in the rest of the year. D. March real PCE growth was below consensus (0.3% instead of 0.5% ) entirely because January and February were revised up. In dollar terms, real PCE in March was right in line with very strong expectations. E. Global consumption is picking up relative to the U.S., bringing an improvement in the outlook.
We expect further weakness in housing starts and in sales of both new and existing homes. We think residential investment will subtract from GDP again in the second quarter. House construction is counted in GDP as a percentage of the median selling price at the time of the start, exaggerating the subtraction when prices are falling along with volumes. On the positive side, we note signs of stabilization in some markets (see the May 9 Wall Street Journal story “Where Home Prices Are Hot Now”). House price weakness helps the buyer, who is usually less wealthy than the seller, one of several factors muting the negative wealth effect. We disagree with the view that housing is a key part of the U.S. and global economy–residential investment was 4.5% of GDP in the first quarter, housing-related sectors provided 4% of new jobs from end-2003 to present. Mortgage equity withdrawals fell from an estimated $695 billion in 2005 to a $283 billion annual rate in the fourth quarter of 2006, yet consumption growth was strong throughout, reaching 3.8% real in the first quarter of 2007.
Buzzcut: Since Bear Stearns was, in the WSJ forecasts (see here, sub.req.), always in the top 10th percentile for 07Q1 GDP growth forecasts until the April survey, and has consistently been in the top 20th percentile for the 07Q2 forecasts, you’ll excuse me if I think the Bear Stearns outlook on the overly optimistic side. (Until the April forecast, Bear Stearn’s prediction of 07Q1 forecasts were always at least 1.3 standard deviations above the mean survey response…)
Bear Stearns may be looking at forcasts as an instrument to enhance positions (consider Everquest) …it is not in their interests to provide an accurate forecast, only a marketable one.
Buzzcut, like Menzie I am more pessimistic than Bear Stearns, and see recession as a bigger worry than inflation. I agree with them, though, in some of the points they make about retail sales relative to consumption, as I noted in my most recent post.
I definitely don’t agree about the Fed. I expect the next change will be a cut, not a hike.