There’s a temptation to view the upward revision to the current account balance, and the components thereof, as yet more evidence that the US external situation is in better shape than commonly perceived.
While the results in the latest release are positive, relative to what we believed before (after all the income deficit for 2006 is not revised away), I wouldn’t say that the situation looks completely different than before the 2007Q1 release.
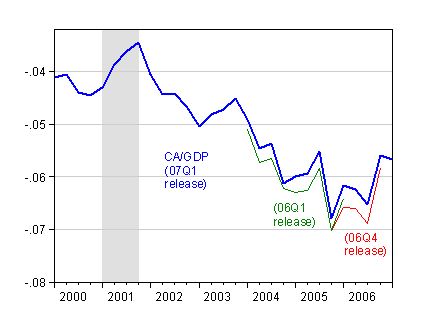
First, consider the revision to the current account balance, expressed as a share of GDP (preliminary release for 07Q1).

Figure 1: Current account balance as a share of GDP, from 2007Q1 international transactions release (blue), 2006Q4 release (red), and 2006Q1 (green). Source: International Transactions releases, and 2007Q1 preliminary GDP release.
The CA balance has indeed been shifted up relative to the 06Q4 release (in red). One interesting aspect is that the 06Q4 release did not change the 2005Q4 figure. In other words, the latest release incorporates revisions of a magnitude and nature that are unlikely to be replicated. The release notes:
“The estimates of the international transactions accounts released today have been updated and revised to reflect newly available source data and a methodological change. The major improvements this year include new and comprehensive estimates of transactions in financial
derivatives, a new methodology for estimating interest received and paid on bonds, and the incorporation of results of the U.S. Treasury Department’s annual survey of securities claims for December 2005 and of securities liabilities for June 2005 (revised) and 2006. The incorporation of these results and other newly available source data led to significant improvements in the estimates of services receipts and services payments, income receipts and income payments, and financial flows for U.S.-owned assets abroad and foreign-owned assets in the United States.”
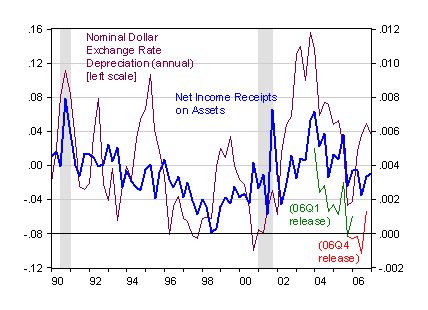
The second observation is that the upward bump in net income receipts is somewhat lackluster given the depreciation in the trade weighted dollar (using a major currencies basket). The dollar depreciation usually boosts returns to the extent that returns on assets abroad are denominated in foreign currency.

Figure 2: Nominal trade weighted dollar exchange rate (narrow basket) annual depreciation (purple, up is depreciation), and net income receipts as a share of GDP, from 2007Q1 international transactions release (blue), 2006Q4 release (red), and 2006Q1 (green). Source: Federal Reserve Board, and International Transactions releases, and 2007Q1 preliminary GDP release.
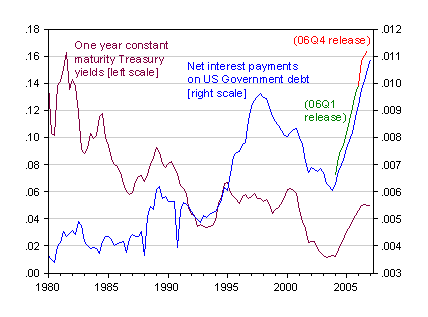
Third, while the revisions pushes down net interest payments on US Government debt, the trajectory remains much the same. Moreover, payments were rising in 2007Q1 despite the fact that interest rates have flattened out. Indeed, payments to foreign bond holders have been rising quarter after quarter, for the last nine quarters…

Figure 3: Nominal one year constant maturity yields (purple), and net income payments as a share of GDP, from 2007Q1 international transactions release (blue), 2006Q4 release (red), and 2006Q1 (green). Source: FREDII, and International Transactions releases, and 2007Q1 preliminary GDP release.
For more discussion of the empirical modeling and projection of these flows, see John Kitchen’s forthcoming paper in Review of International Economics.
A last nugget from the release: The amount the U.S. borrowed from abroad in 2006 was revised upward by $94.7 billion. The amount the rest-of-the-world borrowed from the U.S. was revised upward by $9.4 billion. Including financial derivatives, net inflows were revised upward by $114.0 billion.
Additional coverage is provided by Brad Setser.
Technorati Tags: current account deficit, exchange rate, interest rate, net income.
Menzie — do you have a sense for how the BEA changed its methodology for estimating interest received and paid on bonds? And the reasons for the revisions in the FDI portion of the income balance?
the upward revision in the amount the us borrowed from the world in 06 is also interesting, given that the survey seemed to suggest lower borrowing from mid-05 to mid 06 than the TIC flow data —
i probably am jsut about the only person who really wants to understand the mechanics of how these calculations were done, and what changed.
Hey! I too would like an explanation of this magical new income source. As this isn’t really my line of business, I suggest that one of you guys chat up the BEA. Invoke the Freedom of Information Act if you must. Inquiring minds want to know.
Brad Setser and Emmanuel: While I’m just back from Washington, DC, I did not have an opportunity to quiz the folks at BEA in person. However, a little inquiry leads to the following bits of information: (i) We will have to wait until the July Survey of Current Business to find out the details of why in particular the asset income payments portion of the current account were revised; (ii) the revisions on interest receipts were driven mostly by methodological changes relating to how returns were computed on estimated holdings of foreign securities, and estimated foreign holdings of US securities, rather than by changes in estimates of holdings per se.
For decades any improvement in the US current account essentially stemmed from domestic economic weakness. That does not seem to have changed and these revisions to not seem to be significant.
The CA curve looks bad and deteriorating. The adjustments are cosmetic in nature and probably less than the uncertainty in measurement of GDP.
I don’t think Kitchen has really considered what happens if there’s an…um… unforeseen shock, resulting in a significant rise in rates and drop in the dollar. Nor do I see any reason why the trade deficit will not just continue to worsen.
As another Bush used to say, “Don’t worry. Be happy.”
Den dere’s:
http://www.businessweek.com/magazine/content/07_25/b4039001.htm