Yesterday, Jim presented his latest estimates of the recession probability [1]. Today, I want to update ([2]) where we stand regarding the indicators the NBER uses in judging whether the economy is in a recession.
Recall, the NBER Business Cycle Committee identifies several key variables:
“In choosing the dates of business-cycle turning points, the committee follows standard procedures to assure continuity in the chronology. Because a recession influences the economy broadly and is not confined to one sector, the committee emphasizes economy-wide measures of economic activity. The committee views real GDP as the single best measure of aggregate economic activity. In determining whether a recession has occurred and in identifying the approximate dates of the peak and the trough, the committee therefore places considerable weight on the estimates of real GDP issued by the Bureau of Economic Analysis of the U.S. Department of Commerce. The traditional role of the committee is to maintain a monthly chronology, however, and the BEA’s real GDP estimates are only available quarterly. For this reason, the committee refers to a variety of monthly indicators to determine the months of peaks and troughs.
The committee places particular emphasis on two monthly measures of activity across the entire economy: (1) personal income less transfer payments, in real terms and (2) employment. In addition, the committee refers to two indicators with coverage primarily of manufacturing and goods: (3) industrial production and (4) the volume of sales of the manufacturing and wholesale-retail sectors adjusted for price changes. The committee also looks at monthly estimates of real GDP such as those prepared by Macroeconomic Advisers (see http://www.macroadvisers.com). Although these indicators are the most important measures considered by the NBER in developing its business cycle chronology, there is no fixed rule about which other measures contribute information to the process.” [emphasis added]
Figure 1 presents real GDP on a quarterly basis (I don’t have access to the Macroeconomic Advisers series). Figure 2 presents industrial production and payroll employment. All three of these series are still trending upward. Figure 3 presents real manufacturing and trade sales, and real personal income less transfers.
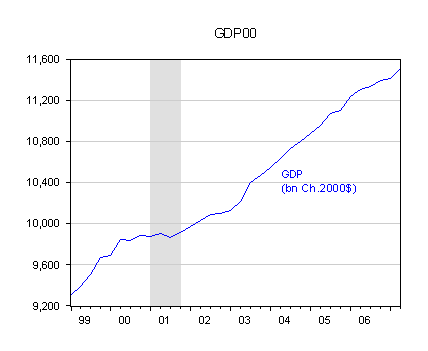
Figure 1: Real GDP in billions of Ch.2000$, SAAR. NBER defined recession dates shaded gray. Source: BEA, July 27 release, and NBER.
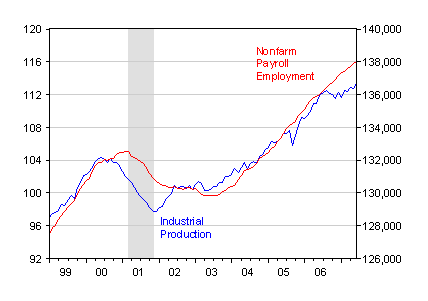
Figure 2: Industrial production (blue, left scale) and Nonfarm Payroll Employment (red, right scale), seasonally adusted. NBER defined recession dates shaded gray. Source: Federal Reserve and BLS via FRED II, and NBER.
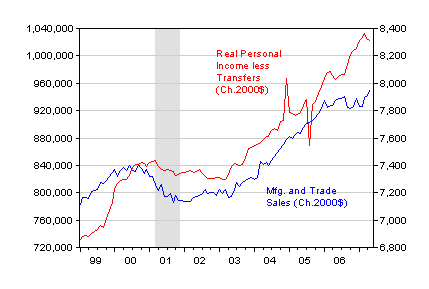
Figure 3: Manufacturing and Trade Sales (blue, left scale), and Personal Income less Transfers (red, right scale), in billions in Ch.2000$, seasonally adjusted. NBER defined recession dates shaded gray. Source: Census Bureau, BEA, NBER and author’s calculations.
Of the last two series, only the income variable seems to be clearly declining. Sales deflated by the personal consumption expenditure deflator seem to be recovering from a slump late last year. So these data seem to indicate little reason to worry.
However, there is one important point to remember — the data get revised. Below, I reproduce some figures from a post last August. In Figures 4-5, the May 2001 vintages of these series (from St. Louis Fed’s ALFRED), as well as the November 2001 payroll series(drawn from Robert Hall’s database) are portrayed alongside the August 2006 series (drawn from the St. Louis Fed’s FRED II).
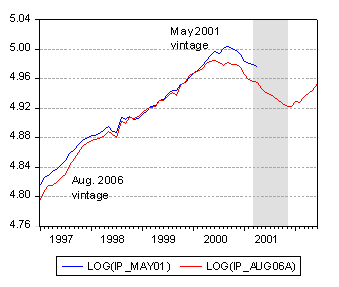
Figure 4: Industrial production (in log terms, 2006 series rescaled). Source: St. Louis Fed ALFRED and FRED II, and author’s calculations.
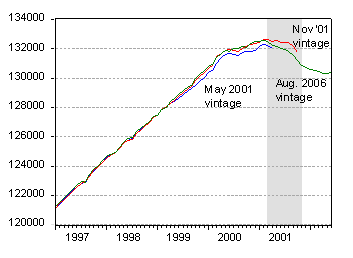
Figure 5: Nonfarm payroll employment. Source: NBER Business Cycle Dating Committee and St. Louis Fed ALFRED and FRED II.
The Industrial Production series has been rebased, so the two vintages of data cannot really be compared (I used the log ratio in 1971m12 to rescale the two series so that they match exactly in that month and before).
Note the November 2001 vintage IP series hits a peak in September 2000; in the August 2006 vintage series, it hits a peak in June 2000. In contrast, nonfarm payroll employment peaks in February, or March, or February (2001), as one uses the May, November 2001 or August 2006 vintages. The key difference in payroll employment is that the more recent data exhibit a much more pronounced employment decline than the November 2001 vintage used to determine the onset of the last recession.
So, if one thinks there are big revisions coming in payroll employment (plausible), and perhaps in GDP (also plausible), then — to quote Jim — “the latest GDP numbers do not prove that we’re out of the woods yet.” [1]
On that note, I leave you with a picture of the annualized growth rate (in log terms) of real GDP, as indicated in May 2001 (blue) and as of May 2006 (red), retrieved from the Philadelphia Fed’s realtime database.
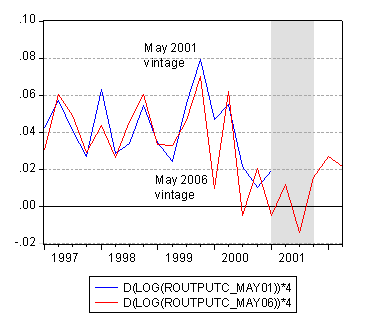
Figure 6: Annualized quarter-on-quarter growth rate of real GDP (in log terms). Source: Philadelphia Fed’s realtime database, St. Louis Fed, and author’s calculations.
Technorati Tags: recession,
GDP,
industrial production, and
nonfarm payroll employment.
While these indicators are important and the issue of recession deserves serious consideration I worry more about the economy slipping into a stagnation scenario rather than an actual recession. Normally a recession contains the seeds of its own end and recovery. But if we slip into a period of continued sub-par growth — around 1% to 2% for example — without an inventory correction this could actually be a worse scenario than a recession because it might be harder to break out of than a recession.
Very nice analysis, Professor. Good to see the original data and views of such five years later.
Yep, the Census BED report on Q4 06 employement, released in two weeks or so, will be very interesting reading.
Spencer, I think the determination of recession or not is important from a stock market perspective. Given how psychology drives the market day-to-day, if we are in a recession (I think we are) and such is authoritatively pronounced, hello big correction in the market (which I have been banking on via SDS since early March).
By my calculations, since 1950, in the nine times that the U.S. has entered a recession, the S&P 500 moved down a median of 19% (S&P 500 at start of recession to subsequent trough of S&P 500).
You have to remember, the “ode” of recession is defined in different ways. Financial, labor ete ete. Generally the NBER will define a recession when all parts seem to have alligned.
I could argue the 2001 recession began in 2000,or 1989 was the beginning of recession, financially it definitely was in recession both times.
I believe that employment is a lagging indicator. Just looking at all previous recession you can see that employment peaks well after stock market enters the bear market and right before the actual recession.
Spencer,
Great point, and stagnation does not appear to be as bad as a recession in the historical record.
The fact is that all of the indicators used by government decision makers are lagging indicators, sometimes by as much as a year. How can we delude ourselves into believing that the best way to “drive” the economy is by looking in the rear view mirror?
I don’t really buy all this recession talk, not while profits are booming – which is after all what capitalism’s all about – why would the US go into recession when the rest of the world is doing so well? Not least because of the huge amount of foreign investment the US has across the world.
According to Global Insight, the losses arising from the sub-prime crisis will only amount to between $50-100 bn, not much as they point out in a $13tn economy.
DickF wrote:
Spencer,
Great point, and stagnation does not appear to be as bad as a recession in the historical record.
Spencer,
I was not clear here. I agree with you that stagnation is worse. What I meant is that it doesn’t appear worse in the historical record. This is one of the problems with historical analysis. Those who do not live through it sometimes rely on the statistics that can hide real issues.
By publishing this post, I did not mean to say that these were all the indicators that policymakers or other analysts looked at. Rather, these were the ones the NBER Business Cycle Dating Committee looks at.
I mention this because of DickF‘s assertion:
I don’t know how one can make a statement like this in these days. Policymakers — especially those in the monetary sector — look at all sorts of leading indicators, including spreads. All sorts of consumption indicators (sales, etc.) can be leading indicators, of admittedly variable predictive quality. Go to the SF Fed’s FedViews graphs, and you’ll see plenty of futures prices, surveys of forecasts (Blue Chip) and capital goods spending (a forward looking variable).
bill j: I agree corporate profits are high right now. But you should take a look at Figure 4 in this post, as a cautionary note.
In other words, this post has a rather mundane message: there is information content in the reported statistics, but one always has to remember that some of them are subject to substantial revision. I suspect (but can’t cite off the top of my head a reference) that revisions tend to be bigger around turning points.
Thanks for the tip, and of course as you say everything is always subject to revision, but profits growth, since the last slow down in 2003 and profits as a proportion of national income are at record levels (correct me if I’m wrong.)
Comparing say the current cycle with the “recession probability index” cycle chart, it would appear what we’re going through at present is a typical mid cycle spike, except of course during the 1970s/80s, i.e. during a general down phase in the world economy, the mid cycle spikes also became recessions, whereas now, in a general up phase they are scarcely a blip…as you can maybe tell I like the idea of Kondratiev/Mandel long waves!
Below is a link to a Fed working paper from a few years ago on the topic of data revisions and turning points in the economy.
http://www.philadelphiafed.org/econ/conf/dynam.pdf
Confirmation that things are slow here in San Diego: a Porsche Carrera GT has been sitting on display, for sale, for two weeks now at Symbolic Motors here in La Jolla. This is a limited production vehicle that costs ~$600K, and for which there was a waiting list when it first came out two years ago or so.
Yep, times are getting tough here in San Diego.