Definitely some things to be encouraged about by the latest GDP report, but the overall impression of economic weakness remains.
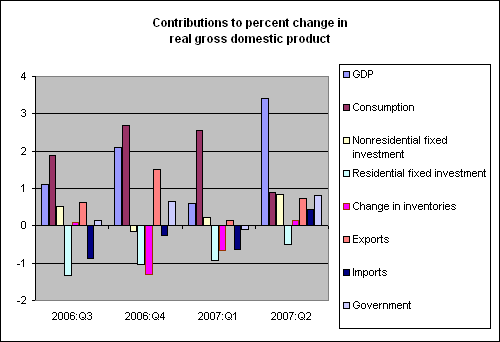
The Bureau of Economic Analysis reported today that U.S. real GDP grew at a 3.4% annual rate in the second quarter, a substantial improvement over the 0.6% rate now claimed for the first quarter. I was not expecting consumption to continue making the strong contribution it had to 2006:Q4 and 2007:Q1 growth, and that proved to be correct– real personal consumption spending grew at only a 1.3% annual rate in 2007:Q2, compared with its average 3.2% growth over the preceding four quarters.

Housing investment subtracted only 0.5% from the total 2007:Q2 growth rate, an improvement over the -1.0% average contribution over the preceding four quarters. But I fear that the future data for this sector will not be bright.
Despite the weak contribution from consumption and continuing drag from housing, the other components of GDP picked up the slack. Particularly encouraging was the very strong contribution of nonresidential fixed investment, which grew at an 8.1% annual rate in 2007:Q2, enough to contribute +0.8% to total GDP growth all by itself. Declining imports and growing exports contributed an additional 1.2%, another very welcome development. Higher government spending also contributed 0.8% in 2007:Q2 after having subtracted 0.1% in the first quarter. Both observations there are a bit anomalous. It makes more sense to average the two quarters as far as government spending is concerned, and I’m inclined to take the same approach for total GDP. The 0.6% Q1 and 3.4% Q2 give us a 2.0% average GDP growth rate for the first half, a slight improvement over the 1.6% growth of 2006:H2, and a continuation of the overall impression that the economy is growing– sluggishly, but nonetheless still growing.
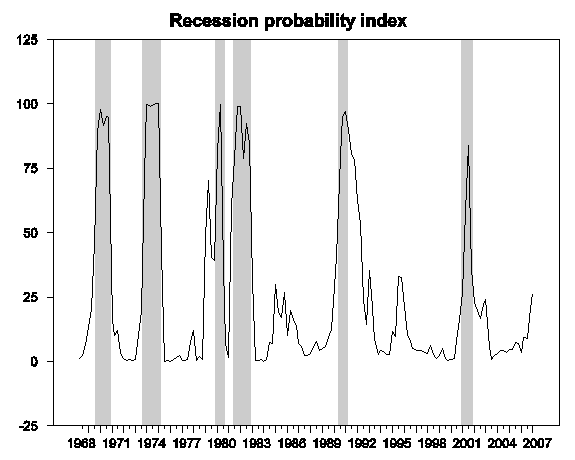
The new GDP numbers also allow us to update our recession probability index. This is a simple pattern-recognition algorithm that looks at whether the recent behavior of GDP looks more like what typically happens in an expansion or a recession. It is not a forecast of what may come next, but rather an assessment of where the economy has been. To do this with sufficient reliability to describe the state of the economy for 2007:Q2, we will want to wait another quarter for the data to be revised and the further very useful signal about 2007:Q2 that will come from the advance 2007:Q3 estimate when it is released in October. With the just-released 2007:Q2 data, we are in a position to make the call for 2007:Q1. The growth rate for that quarter is now reported to have been 0.6%, and it followed a string of weak growth rates in 2006. As a result, the value of the recession probability index for 2007:Q1 turns out to be 26.2%, its highest value since 2001:Q4.

|
Note that this inference does make use of the strong 2007:Q2 advance estimates– had 2007:Q2 growth been weaker, the inference for 2007:Q1 would have been even more pessimistic. All of which is a reminder that the latest GDP numbers do not prove that we’re out of the woods yet.
Technorati Tags: GDP,
recession probability,
recession probability index,
macroeconomics,
economics
Looking at the pattern, can we say the recession has begun or about to begin?
No, Pankaj. It’s still more likely than not that no recession has yet begun, though this has been a protracted period of unusually weak GDP growth. So far that’s all it appears to be.
Based on my research with this methodology, I would not declare that a recession has begun until the index rises above 67%.
Just an observation, but it appears anytime the prediction percent exceeded ~33% it continued higher and a recession started (rather abruptly). Based on this, we would appear to be very close to a downturn.
Another indicator I saw on another blog yesterday was new housing sales. I think we were around an 850 million rate for 2007, but sliding fast. Every time in the past 40 years when new home sales went below 600 million we slid into recession. This could easily happen in 2008.
It’s 1995 all over again!
Yep, GDP grew 3.4%. But, when just under two thirds of that growth (2.1%) comes from building offices and stores, Federal government, state/local government, medical care, and housing, that does not seem to be ‘healthy’ growth.
Man, folks must be spooked, with the further sell-off of the markets, given the strong headline GDP growth.
July 27, 2007
The week ended with another thumping for US Equities and Canadian stocks went along for the ride, notably
BCE Inc., target of the largest buyout, retreated after Citi Investment Research cut its recommendation, citing growing risks to its financing.
On…
It’s hard not to be a little skeptical of the +8.1% gain in Nonres Fixed Investment, especially considering how nonresidential building projects tend to follow trends in residential development with a 2-3 year lag.
Maybe it’s going to be a race between very strong NonBuilding Construction (up +43% in May, according to FW Dodge) and decelerating NonResidential Building projects (+4% in May, same source). There’s a pretty good summary available here:
http://www.construction.com/ResourceCenter/forecast/2007/Jun.asp
But anyway, with the Consumer being 2/3 of GDP and higher oil/gasoline prices probably continuing to take a bite out of discretionary spending, it’s hard to see the +3.4% gain in GDP being repeated anytime soon. We’ll see, I suppose.
The nascent credit crunch may or may not grow into a drag on the real economy – it ought to remain limited to a financial crisis only, but that probably depends on whether or not the adults in charge of monitoring developments make any egregious errors along the way, or not. I would observe that media reports so far this weekend have maintained there ridiculously optimistic tone – apparently they’ve managed to identify ONE, yep, ONE hedge fund (Sowood Capital) with some “issues” but Sowood is only down 10% so far this year and isn’t thinking of closing down. My perception is that hedge fund/fixed income reality is much uglier than that, though it may take another couple of weeks or even a month or two for hedge fund managers to give up on the denial phase of mourning and for the mass media to catch up.
Thanks for the cogent summary.
Any reaction to the still-weak performance of capital equip & software (SAAR 2.3% after 0 & -5%)as compared to the strong growth in structures?
And should we be viewing the lower productivity implied by the downward rev. of past GDP as implying a lower trend growth of potential GDP? Especially in light of slow cap ex?
Gee which way do you think this one will be revised…
I notice in the above chart that the growth in the indicator is decelerating, which doesn’t appear to have happened in any of the previous slowdowns that eventually became recessions. In the late 60’s and dot com bust, looks like this indicator slowly increased for a while, and then starting up. The current period looks similar to the late 80s recession, but by this point in that era the indicator was accelerating higher, not slowing down like we see here. Obviously this is preliminary and subject to revision, but I think hopeful news that this could be merely a slowdown.
Jim – I would love to see what this chart looks like with Q2 revised down slightly, and with the lower range of predictions for Q3 (from Northern Trust perhaps?) – do we still see the indicator not growing much or even peaking?
I’ve noticed that my personal fortunes have usually been countercyclical. I’m better off financially during recessions.
Why would that be?
MikeB, I think it is very hard to interpret a productivity slowdown at a time like this as indicating slower potential GDP growth, because there is such a strong cyclical effect on productivity of slow demand growth. This is perhaps most obvious in the housing sector, where movements in productivity are being completely dominated by slow sales. As for equip and software, Calculated Risk has more. I would describe his bottom line as being that a significant demand slowdown would likely also bring equip and software down with it.
Using positive GDP growth rates to predict negative GDP growth rates seems circular. Its like using historical CPI data to predict future inflation. I’ll take your word that the math in your analysis is good, but I’m talking about economic logic. Another analysis that looks at the depth and duration of inverted yield curves gives much higher probability of recession. This is not to say that inverted yield is the only driver towards inflation, but the analysis deals with drivers and outcomes, i.e. it tries to represent economic logic.
In case you haven’t guessed, I think you are way off. The recession is baked in the cake. We are only talking about how many more months until wage and salary numbers start to decline.
Mike, you are misinterpreting the index. I am not trying to predict future GDP growth (though the calculations do have an implication for that). Instead, I am simply trying to assess whether or not a recession had begun as of 2007:Q1.
JDH, upon re-reading, I see that strictly speaking the index is rear-looking, though some wording suggests a forward view. But for an analysis done on July 27, after 3.4% GDP growth in the second quarter, why is any sophisticated math needed to decide whether Q1, 2007 was the beginning of a recession? Adjustments happen, but not 3.4% total adjustments. Simple inspection seems to do it – or am I missing something that could be significant? To me, the only major question is a forward looking “when does it turn”?
Mike, the most authoritative source most people turn to for an a determination of whether the economy currently is or is not in a recession is the Business Cycle Dating Committee of the National Bureau of Economic Research. Their most recent announcement was made in July 2003, at which point they declared that the recent U.S. recession ended in November 2001. I remember talking to a reporter in January, 2003, telling him that the recession was over, and he looked at me like I was an alien from Mars who knew nothing. Much of the political debate in the fall of 2002 seemed to presume that a recession was still going on.
I therefore believe there is considerable value in trying to make these declarations in a more timely fashion than does the NBER. However, I think the fundamental nature of the problem does require you to collect sufficient data to be confident in your call. Using this index approach, I expect to be able to make the declarations of when a recession begins and ends sooner than NBER does, but not a whole lot sooner. I do believe there is some value in this exer cise, though I agree that it is not quite as exciting as what you originally supposed I may have been doing, namely predicting when the next recession will begin.