I recently completed a new research paper studying how interest rates of different maturities change with market expectations of what the Fed is going to do next.
Settlement on a fed funds futures contract is based on the average effective fed funds rate over each of the calendar days of a specified month. If a month contains N calendar days and rt denotes the effective fed funds rate on date t, settlement of the contract is based on the value of
My latest research paper uses just the spot-month contract, whose payoff is based on what the current month’s average fed funds rate turns out to be. Suppose that the Fed raises the target by 50 basis points on the 16th day of a month containing N = 30 calendar days. If the target change doesn’t alter the fed funds rate for days 1 through 15, it would only raise the average effective rate over the month by 25 basis points, since half the observations that go into the average would be at the lower rate. If market participants had previously been assuming there would be no change at all, and then learned on some day t early in the month that the change was coming on the 16th, we would see the fed funds futures rate move on day t by 25 basis points, even though the market knows a 50-point hike is coming, as a consequence of the averaging. If we wanted to infer the change in the market’s expectation of the fed funds target from the change in the spot-month contract, we would need to multiply the observed spot-month contract change by 2. In general, for a month in which the target change, if it occurs, will come on day n of the month, a paper by Oberlin Professor Ken Kuttner published in the Journal of Monetary Economics in 2001 used such reasoning to propose that the change in the market’s expectation of the target might be measured by
where ΔF is the observed change in the spot-month contract.
There are a couple of concerns that Kuttner and others have raised about this expression, however. For one thing, it does not take into account the fact that the effective fed funds rate (on which the futures contract payoff is based) is not exactly the same as the target rate itself. There are often quite significant deviations towards the end of the month, and the formula above would severely amplify this end-of-month measurement error. Furthermore, although there are some months when everybody knows exactly when the change, if there is to be one, is going to occur, there are also other months where we really don’t know, and some times when a target change did occur but was not announced, and the market did not immediately realize it. We speculated here at Econbrowser as to whether this could have happened this August, and a paper by Poole, Rasche, and Thornton discusses a number of other historical episodes.
My latest paper generalizes Kuttner’s formula in three directions. First, I explicitly model deviations between the effective rate and the target, and show how to modify the formula to take into account this measurement error. Second, I take the view that markets may be gradually learning about the target change well before it actually occurs. And third, I ask what the data would look like if the econometrician does not assume to know the exact date on which the target was changed.
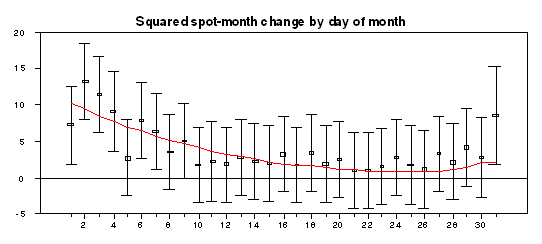
These modifications imply a certain pattern for the volatility of daily changes in the spot-month futures contract over the days of the month. The volatility generally should decline during the month, as uncertainty becomes resolved as to what this month’s target is going to be, but then increases again a bit at the end of the month due to the greater volatility of deviations of the target from the actual on those days:
 |
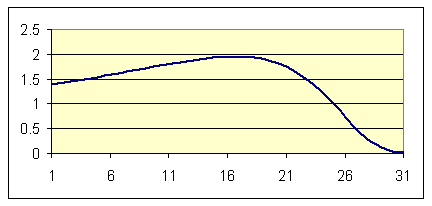
On the basis of the observed volatility of fed funds futures and the effective fed funds rate, the framework then implies a generalization of the Kuttner weights one should use to multiply an observed change in the spot-month futures contract to infer the change in the market’s expectation of the target. The relation is not monotonic. The ideal weight initially increases as one gets farther into the month, for the same reason as the original Kuttner formula. But it then starts the decrease in the last third of the month, because it is more likely that spot-month changes on those days are driven by noise in the effective fed funds rate rather than news about the target itself.
 |
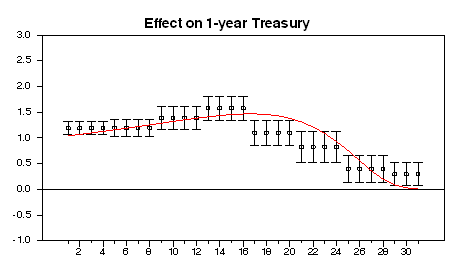
The model then implies a prediction as to what sort of response one should see of an interest rate such as the 1-year Treasury yield to a given change in the spot-month contract. Since it is the target itself, and not deviations between the effective rate and the target, that will matter for longer term yields, the coefficient from a regression of the change in yield on the spot-month change should show exactly the same calendar pattern as the figure above. The following figure reproduces the predicted pattern (the smooth red line), as well as the actual estimated coefficients when days of the month are grouped into octiles based on calendar date. The prediction seems to fit the facts reasonably well.
 |
One thing we obtain from such calculations is an estimated average extent to which interest rates of various maturities respond to news about what the Fed is gong to select for the target for the current month. I found that a 10-basis-point increase in the expected target was on average associated with a 6- or 7-basis-point increase in Treasury yields at horizons up to 3 years, and a 4-basis-point increase even for a 10-year horizon. Although the methods and data sets are rather different from those of earlier researchers, these estimates are very similar to those obtained by earlier researchers. The consistent finding in this literature has been that changes in Fed policy have surprisingly long-lived consequences.
| Maturity | Response |
| 3 months | 0.66 |
| 6 months | 0.71 |
| 1 year | 0.75 |
| 2 years | 0.68 |
| 3 years | 0.64 |
| 10 years | 0.43 |
Technorati Tags: macroeconomics,
Federal Reserve,
interest rates,
economics
Firstly, thank you
Fairly large SD. I realize that you don’t recognize non-normal distributions.
IMO, your presentation is less than useful.
Why
Because you try to rationalize a fixed outcome.
We are in a period of supply side economics that has no precedence. That is probably why your graphs go outside the lines (above I might add)
Don’t stretch Prof. Your balloon don’t float. That is okay, been there.
Jim,
I haven’t yet read your article, but noted the long sample period from 1988 to 2006. Off the top of my head I would expect different market reactions to changes in the spot month funds contract during subperiods of this sample reflecting such phenomena as the evolving movement from a Borrowings assumption in the late 1990s to an explicit funds target. Also, the evolving trend towards increased transparency during this period, especially the formal announcements of policy changes beginning in 1994. In all but the final year of your sample Greenspan was Chair. Greenspan had a reputation for front running the FOMC, providing forward looking guidance to the outcomes of upcoming FOMC meetings. Ben on the other hand appears to be more respectful of the role of the Committee and seems less willing to provide guidance in front of meetings. One final thought, I don’t recall the specifics of the birth date of the Fed funds contract, but my recollection is that it was very illiquid in the early going, could this illiquidity be a problem for the early portion of your sample. I apologize for offering these thoughts in advance of my actually reading your paper, but the Blog makes such too inviting.
Ray, I can’t quarrel with your objections. There’s always a tradeoff in econometrics– when you try to use as much data as possible, you increase the risk of including observations whose fundamental driving forces may not be the same across subperiods. I’ve chosen in this analysis to take the first option and use the full sample, thus opening myself to the valid criticism that the regression is only able to summarize the average tendency over the complete sample rather than give us insight into how the relation may have changed over time.
I do think, however, that the full sample is the appropriate one for demonstrating the overall nature of these calendar effects. Once we have the right broad framework for thinking about these, which I feel I’ve proposed here, we can go back into some of the details you raise. That, anyway, is how I’m thinking of the research program.
Curious comment, zinc. Accounting for departures from Normality should increase the size of the standard errors relative to those reported, which would improve the reported statistical fit.
Wouldn’t using the second or third fed funds contract provide a more meaningful study? The market’s expectations as to what the Fed is going to do are very well formed in the spot contract, so you are really for the most part studying the machinations of the day-to-day funding market. By moving a contract or two further out, you would be picking up more of the future expectations of Fed moves playing through the market. At least that’s the non-academic observation of someone who trades fed fund futures, and I rarely have a trading position in the spot contract.
Jim: Doesn’t this have consequences for the usefulness of yield curve slope as a recession predictor? In other words, a flat curve indicates expectations of fed cuts, not really a recession. There’s probably a correlation, because fed cuts would usually happen during economic weakness, but not causation.