The latest GDP release suggests trade balance adjustment is proceeding. Some of the adjustment is being driven by changes in the dollar’s value. But I think a lot seems to be coming from the reduction in consumption and income growth.
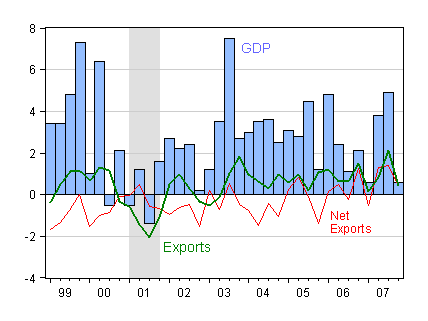
First, let’s take a look at the how much of GDP growth in 2007Q4 was being driven by net exports, and exports.

Figure 1: GDP growth (blue bars), and contributions from Net Exports (red line) and Exports (green line). NBER Recession dates shaded gray. Source: BEA, NIPA release of 30 January 2008, and NBER.
Interestingly, net exports and exports constituted for a very large chunk of the total growth recorded. And, in contrast to Q3, import reduction only accounted for a negligible portion of GDP growth.
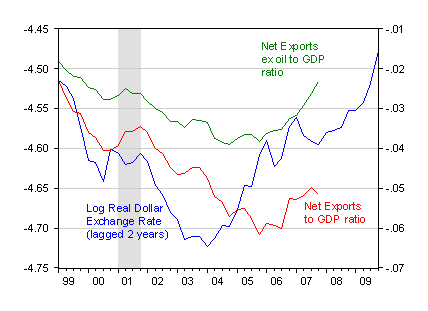
The non-oil net exports to GDP ratio is hurtling toward 2 ppts of GDP, as shown in Figure 2.

Figure 2: Log real dollar exchange rate (broad), lagged two years (blue) and net exports to GDP ratio (red) and net exports ex oil to GDP ratio (green). NBER recession dates shaded gray. Source: Federal Reserve Board, BEA, NIPA release of 30 January 2008, NBER, and author’s calculations.
However, the total net exports to GDP deficit has stalled at around 5% of GDP. While this is an improvement relative to 2005-06, this is about the same as the level recorded at the beginning of 2004, when alarm was growing about the trade deficit.
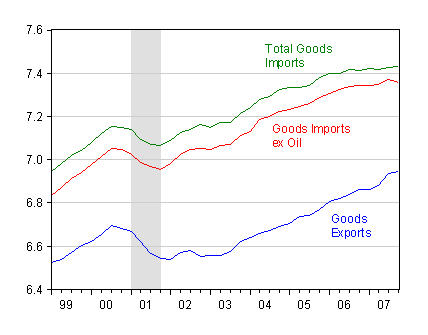
Inspection of the goods exports and imports series highlights some interesting trends (Figure 3). First, goods exports did surge in the last few quarters, but have tailed off in the last quarter (keeping in mind Q4 trade figures are based upon only two months of trade data). In contrast, non-oil goods imports are declining. While it is possible to have this occur without a recession (as in the late 1980’s and in early 1995), the decline does appear to be consistent with a substantial slowdown in overall economic activity.

Figure 3: Log real goods exports (blue), log real goods imports (green) and log real goods imports ex oil (red). NBER recession dates shaded gray. Source: BEA, NIPA release of 30 January 2008, NBER, and author’s calculations.
In a previous post, I noted that one of the channels by which monetary policy could increase output is by inducing expenditure switching. Of course, there are offsetting effects, since higher income associated with expansionary monetary policy induces more imports, which (in an accounting sense) subtract from GDP, but there should be on net a positive impact. But the effect, at least on imports, is likely to be small because the estimated exchange rate elasticity is about 0.3, according to my estimates [1]. The elasticities are higher on the export side. But both are substantially smaller than estimated income elasticities.
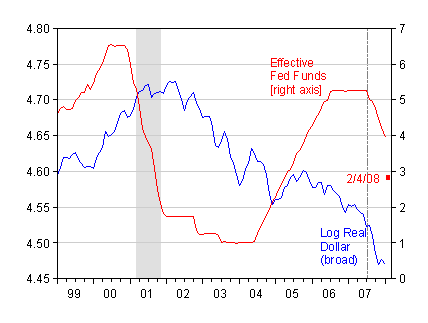
That being said, the impact of decreases of the effective Fed Funds rate on the exchange rate, while apparent, does not seem very large. The real trade weighted broad dollar has declined about 5% (in log terms) since the Fed Funds rate has begun its downard descent.

Figure 4: Log real value of US dollar (blue, left axis) and Effective Fed Funds rate (red, right axis). Source: Federal Reserve Board.
It’s important to recall that correlation is not causation. The declines in the dollar’s value could come from other factors correlated with the Fed’s monetary policy decisions (the decline in the desirability of dollar assets, for instance). What is also true is the dollar was declining long before the prospects of accomodating monetary policy became apparent. (Indeed, in this post I pointed out that the dollar was only maintaining its strength throughout 2005 by virtue of the incremental increases in the Fed Funds rate, and that when those ceased, we’d see the dollar depreciate secularly.)
So look for an impact on net exports coming from the drops in the interest rate, but not right away. Maybe in a year or two… In the meantime, I expect the reduction in the trade deficit to come mostly from the slowdown (if not recession), and a reduction in the consumption to GDP ratio (see Brad Setser’s post on this point).
Technorati Tags: trade deficit,
imports,
exports, monetary policy,
dollar.
Professors, IANAE. That said:
The lack of correlation between the FFR and the dollar’s trade weighted value is very interesting to me. I think that is just another relic of Greenspan’s conundrum, which is itself due to the recycling of reserves by foreign central banks. Long rates have become poorly anchored to short rates because capital is so mobile.
That’s why I found today’s carnage in the long bond markets so interesting. As you probably know, it resulted apparently from a very poor 30 year treasury auction. There was an extremely low bid-to-cover ratio, and low indirect bidding. The auction rate was substantially above the prevailing market rate. Why? I’d like your take on my interpretation.
Again, a large percentage of the bidders at recent treasury auctions were foreign central banks. I believe that the low bid-to-cover ratio and the low indirect bidding were a result of the Asian central banks and oil exporters having very little currency reserves being accumulated due to the slowdown in the U.S. economy and its concomitant effect on their exports and the need to convert USD to local currency. That seems to fit well with your explanation that much of this adjustment is from a decline in domestic U.S. demand, since we import so much from the pegging countries. Without much in the way of cash reserves building, they just didn’t need to buy much in the way of treasuries.
The USD went up dramatically today, and TIPS kept pace with nominal treasuries, as well.
I believe all this is just a manifestation of a significant increase in the US economy’s real interest rate. We’ve had a withdrawal of such massive sources of liquidity as the CDO market, the ABCP market, and now, perhaps the investment of foreign central banks and sovereign funds. That the real cost of capital, the velocity of money, and value of cash would soar in response is not a big surprise.
That’s all pretty disinflationary stuff. We know the Fed’s been cutting rapidly in an effort to head off a liquidity trap resulting from nominal rates being too high. A lot of people are interpreting this as capital flight due to Federal Reserve profligacy. On the contrary, even with Bernanke at the helm, I think they’re being too conservative. I’d suggest they need to cut a lot more, and quickly.
I have no formal training. I’ve probably made enormous mistakes. Could someone please spare a moment on elucidation?
ndk, I’m not saying that you’re wrong, and you certainly have done a detailed and thorough analysis.
But you’re reading a lot into a jump of a tenth of a point or so.
Point of fact, those 10 year rates are in the 3.7% range, down from their August highs of over 5%. That is a pathetically low rate!
And the rate is down 0.05% today as I write this.
It’s an interesting theory, though.
Did you see how Mankiw misrepresented your work?
ndk: I think that, while part of the conundrum was attributable to international factors (e.g., see Warnock and Warnock’s work), I think a large factor was the temporary disappearance of a risk component in the term premium for long term yields. That has returned, and so the current situation is in some sense more “normal” than it was earlier. My own work with Jeff Frankel doesn’t ascribe more than a percentage point or so to the international factor you mention.
When you speak of the real interest rate rising, I think you have to be careful about which one your referring to. I think that you mean the non-risk-free rate. US government yields, as measured by TIPS or nominal interest rates adjusted by survey-based expected inflation rates, are still pretty low.
I looked briefly at your blogpost you referred to. I can’t say I got the full gist of it, but I saw enough to ask whether you really mean that we’re in a liquidity trap, or facing an imminent liquidity trap. Liquidity traps can arise because of the zero bound on nominal interest rates, or (more loosely defined) when the substitutability of money and bonds becomes extremely high. We’re not in either situation, I think. So, here I’m with buzzcut in thinking the source of our problems lie elsewhere.
spencer: Thanks – had not seen this post by Mankiw. I’m not sure “mis-represent” is the exact word, although it’s true the main thrust of that particular post was dropped. I do think exchange rates affect trade flows. It’s just that I don’t think most of the reduction in the trade deficit will be coming from expenditure switching. Oh, well. As they say, no such thing as bad publicity…
Menzie,
Thanks a lot for the ideas, and I’ll follow up with the papers you’ve referenced. Why do you suppose that Stiglitz hinted at a liquidity trap being imminent? Did you follow that piece of news? Is it just the Telegraph being sensational as always?
http://www.telegraph.co.uk/money/main.jhtml?xml=/money/2008/01/24/bcnstig124.xml
I also looked at long-term real treasury rates:
http://www.treas.gov/offices/domestic-finance/debt-management/interest-rate/real_ltcompositeindex_historical.shtml
At the peak of housing prices, it was 2%. We’re at 1.8% today. In the interim, it never climbed to much more than 2.4%. The tiny variation here is probably swamped by other factors in private decision making, so I would still contend they’re fairly high today and were low back in the boom.
Why would the term premium have disappeared, though? Was that precisely the credible commitment to keeping rates irrationally low for a long period of time? Interesting idea.
The real rate has changed a lot more drastically on the shorter end(5y) than the long end through this interest rate cycle, which suggests the term premium only compressed for a couple years of expectations and then mean reversion was expected — right?
Thanks a lot for your time. 😀
Two more things: Brad Setser mentioned that work that he’s done suggests that foreign central banks purchases are weighted towards the short end of the curve and rarely go beyond 10 years. I’ll read your paper to get more of your insights, but I wanted to throw that out.
#2: My Goodness, but you’re prolific. :O
ndk: My impression is that Stiglitz is using liquidity trap in a loose sense. I don’t disagree that monetary policy might be relatively ineffective. See today’s NYT article by Morgenson.
For longer time series on real ten year rates, see this post. I’d say the term premium compressed because of the “search for yield” arose after agents mis-estimated the amount of risk (or the risk was “obscured” perhaps intentionally).
Re: where the central banks are buying. I agree, but (particularly in earlier years), central banks did not account for the totality of purchases. There was demand arising from, for instance, pension funds, etc. But I agree that not all of the disappearance of the term premium can be attributed to foreign purchases. The balance is this risk mispricing effect.