Big news yesterday (e.g., WSJ, Abnormal Returns, and Paul Krugman), was the plunge in the January ISM nonmanufacturing business activity index. But what’s it mean?
The Institute for Supply Management has for many years conducted a survey of purchasing managers in the manufacturing sector, asking questions such as whether output and employment are higher or lower than in the preceding month. From these answers it constructs an index, whose value is below 50 when reports of contraction outnumber those for expansion. I noted with concern when the ISM manufacturing index slipped below 50 in early January, and voiced my relief when it was reported back above 50 on February 1.
But all the attention yesterday was on a separate index ISM prepares for the non-manufacturing sector, whose latest values certainly look scary when you plot them.
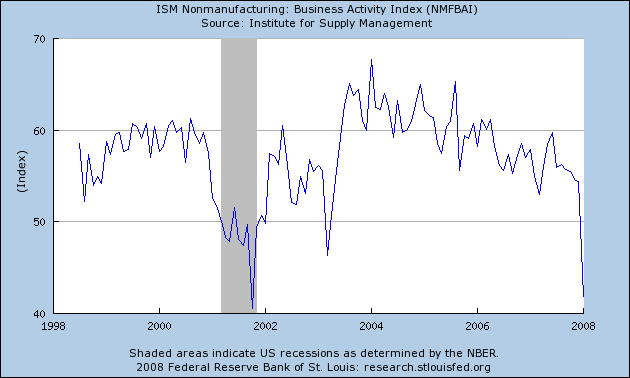 |
This is not a number that most of us had been paying much attention to, until it fell off the cliff yesterday. For one thing, there is not as much of a history with this series to allow us to put the drop in context. The earlier sharp decline in 2003 seems to have been a false alarm, and the other previous big drop arrived at the end of the 2001 recession.
The sectors covered by the ISM nonmanufacturing index include construction, financial services, and real estate, which we knew faced some big problems, though it’s surprising that these would have suddenly shown up in January. It also includes the entertainment industry, which was perhaps affected by the writers’ strike, though if that’s the explanation it’s hard to square with a sudden drop in January. Retail trade is also covered, and perhaps the ISM nonmanufacturing numbers are another harbinger that next week’s retail sales numbers will be disastrous.
For my tastes, Jeffrey Miller offered some very useful insights (as he invariably does). Jeffrey wrote yesterday:
Today’s [stock market] trading was sparked by the ISM services report, something that has not attracted much attention in recent years. The Market has focused more on the traditional ISM manufacturing survey, partly because it has a longer history, and a clear link to GDP. For those who have forgotten that report, released two trading days ago, it suggested GDP growth of 3% as of mid-January, the time of the survey….
We have tested the ISM service series against employment changes and other economic data, and we find it to be pretty good. When comparing it to the ISM manufacturing index we discovered that it did not add much information. We now have a single data point where there is a significant divergence. This would be nice to test, but there are not many other divergences to use.
Our review of today’s news did not find anyone else who highlighted this statistical fact, or wondered about the meaning.
Excellent observation, Jeffrey, and I welcome input from anyone who has a good answer. But in the mean time, I’ll agree with the crowd that this is a very ugly-looking move in that series, whatever it ultimately proves to mean.
Technorati Tags: macroeconomics,
employment,
economics,
ISM nonmanufacturing index,
ISM,
recession
What do real estate, financial services, hollywood, and the construction business have in common? They rely for their livelihoods on controlling access to “skills” and “values” that are either mired in crisises of self-doubt or are rapidly democratizing as we speak; respectively: location (real estate), capital growth (financial services), entertainment (obviously), craftsmanship (construction). If learning to live means learning to be skeptical enough about these “skills” and “values” to be able to chose either to become good at them or resist their hegemony, then this whole sector will be well and truly done-for – at least in its current modality.
The situation becomes more complicated given the discrepancy between the Manufacturing and the NonManufacturing reports. Krugman focuses on the non-manufacturing employment component while it is also equally true that the manufacturing employment component is as good in predicting next months payroll change. As a matter of fact the absolute forecasting error of both is approximately the same (60K for Man. and 61K for NonMan.). If you graph them you can confirm that the relationship holds about equally the same for both variables.
The situation becomes EVEN more complicated when one sees that lower levels of the manufacturing component imply above zero payroll changes relative to the non-manufacturing component. Whereas for example readings of above 47 in the man. component predict positive payroll changes next month, one requires above 50 readings for the non-manuf. component to achieve that. As a result, the latest drop in the latter implies a BIG divergence in the predictions of the two variables. The manufacturing employment would forecast an expansion of 80K while the nonmanufacturing index would predict of contraction of 120k jobs. Puzzled? Well, there is one more thing to note: whenever the manufacturing component was significantly higher than the non-manufacturing one in the past (by the way this has not happened more than 6 other times and more importantly it happened when both readings were above 50) it turns out that in the vast majority of the cases (5 out of 6) the Non-Manufacturing had a much smaller forecasting error than the Manufacturing component (2.3 times smaller)!
The sample is clearly very small and I would not put too much into these numbers. The fact of the matter is however, that there is considerable downside risk to the February number, although do not be surprised to see the Jan number in positive territory as these 18k job losses in the government are revised upwards.
Professor,
You said that the “earlier sharp decline in 2003 seems to have been a false alarm”. But the drop was in March when the US went to war in Iraq. The service sector ISM was not the only indicator to fall around that same time.
The manufacturing ISM, Federal Reserve regional surveys, and consumer confidence show a drop of similar magnitude. So I don’t think it should be considered a false alarm any more so than the others.
There’s a serious rumor floating around the market today that there’s a calculation error in the services ISM . . . . . . I tried calling the media relations folks at the Institute and the woman who handles such enquiries is out of the office this afternoon.
I did some poking around the website, the the fact that the data series is a diffusion index where each separate industy within the NAIC classification system registers a score of Increasing, Same or Decreasing. It would be nice to have some “how much” information in addition to the simplistic +1, 0 and -1 scoring . . . . . . .
Just got off the phone with Andrea from ISM. There is no error. Ed Hyman’s wall street economic firm called “ISI” has a separate survey that was giving different results and may have resulted in confusion, along with the fact that the ISM non-manufacturing survey was released several hours early due to a possible leak.
For Further interesting info:
http://www.nacm.org/resource/press_release/CMI_current.shtml
sir,
I am a civil servant in Bhutan. Thought I might ask you for a clarification.
Can “Software Development Company” be classified as a manufacturing Industry? i am of the opinion that it is a service industry. Could you comment?
Samir Mothey, if the company is providing consulting services or writing specific custom software on contract for a company that wants a particular program to perform a particular task, then I would indeed classify that as a “service”. If the company is producing software that is packaged and sold commercially to a large number of users, you could describe that as “manufacturing.” If you know nothing other than the label you gave me, “software development company”, I guess I’d choose to classify that as a service.