Michael Dueker is a senior portfolio strategist at Russell Investments and formerly was an assistant vice president in the Research Department at the Federal Reserve Bank of St. Louis. He has been doing some very interesting economic research recently in developing what he calls a Qual VAR model for predicting recessions. We are pleased that he agreed to share some of the current implications of that research with Econbrowser readers, subject to the disclaimer that the content is the responsibility of the
author and does not represent official positions of Russell Investments
and does not constitute investment advice.
Current recession forecasts indicate that it would be unprecedented not to have a recession in 2008
Despite Intrade.com’s
‘recession’ contract, which is based on two consecutive quarters of
negative GDP growth, the two-quarter rule rarely holds at the time the National Bureau of Economic Research
(NBER) business cycle dating
committee declares business cycle peaks and troughs. At first glance, it might appear that
there is a close relationship between recessions and GDP growth
because of the well-known rule of thumb that a recession corresponds to two consecutive negative
quarters of GDP growth. It turns out, however, that this rule only works well for GDP data that
are revised well after the fact. For real-time GDP data, the two-quarter rule is not at all an
accurate recession guideline. Real-time vintage GDP data from the St. Louis Fed’s
Alfred database show that, among
the last eight business cycle turning points declared by the NBER,
only the peak and trough associated with the 1990-91 recession conform
to the two-quarter rule on the dates that the NBER announced the turning points.
In recent months, many economic
commentators, such as former Federal Reserve Chairman Alan Greenspan, have offered views on the
likelihood
of a U.S. recession
in the near term. A large percentage of these assessments, while useful, are
judgmental in nature and ought to be compared with formal, model-based
recession forecasts.
Here I present current out-of-sample recession probabilities and prior forecast results.
One feature of recession forecasting is that statistical models rarely give
ex ante recession probabilities above 50 percent.
Birchenhall et al. (2001) serves
as an illustration of the way that modelers convert model-based recession probabilities
into yes/no recession calls at a probability threshold well below 50 percent. Of course, this
probability threshold will depend somewhat on the forecast horizon because longer-run forecasts
are hard-pressed to rise much above the unconditional probability of recession, which is about
17 percent. For the model considered here, the 2001 recession provides some guide as to
the probability threshold that one might apply for different forecast horizons.
In order to compare with judgmental recession odds, we have to think about
what Alan Greenspan means when he says that the odds are even that a recession
will occur in 2008. He means that if you take his words as a recession call, there
is at most a 50 percent chance that the call will turn out to be a false alarm.
Accordingly, one way to think about comparing a model-implied probability with a threshold is
to ask how likely it is that a probability above the threshold will turn out to be
a false alarm. For this reason, recession-forecasting models might apply a 32 percent threshold
and claim that there is a 70 percent chance that a recession call based on this probability
threshold will not be a false alarm.
Now the latter claim is hard to prove due to the small number of recessions observed in any
sample, but this translation puts judgmental recession calls and a model-based call on the same
footing.
The specific forecasting model I use is a Qual VAR from
Dueker (2005).
It estimates and adds a business cycle index to a conventional vector autoregression (VAR)
of macroeconomic data.
The observable macro data included in the model are GDP growth, core CPI inflation, the slope of
the yield curve and the federal funds rate. (Note that the recession prediction model
examined here should not be confused with recession recognition models, such as
Chauvet and Hamilton (2006). The latter models discern recessions as soon as they
are evident in
the data without trying to look to the future.) Numerous studies have shown the slope of the
yield curve to be a powerful predictor of the business cycle, especially when combined with
information regarding the level of the real federal funds rate. The model is estimated using
Bayesian methods and the sign of the business cycle index is designed to conform
loosely with the NBER recession classifications, such that the index is generally
negative during recessions and positive during expansions.
One particularly appealing property of the Qual VAR is that because the business cycle index
arises from an equation in a VAR, dynamic forecasts of it are easy to compute.
In order to assess a recession forecasting model, it is important
to backtest it with real-time vintage data to avoid using data that were not available
at the time. Because the model makes use of the NBER recession classifications, it is
important not to report results of forecasts made at times when it was not clear how
the NBER would ultimately date a concurrent or recent recession. When trying to look ahead from
an economic expansion to
predict the onset of a recession, the forecaster has a pretty clear idea of whether the
most recent data come from a time period whose ultimate NBER classification is in doubt.
For example, in the current context in forecasting from the fourth quarter of 2007, we can
be reasonably certain that the NBER will not classify 2007Q4 as a recessionary one
and we can condition out-of-sample forecasts accordingly.
For this reason, the Qual VAR business cycle index model is estimated for the most recent 49
vintages of U.S. GDP data, which gives a set of real-time forecasts back to 1995Q3.
For each vintage, we know the precise history of GDP data that was
available at the time.
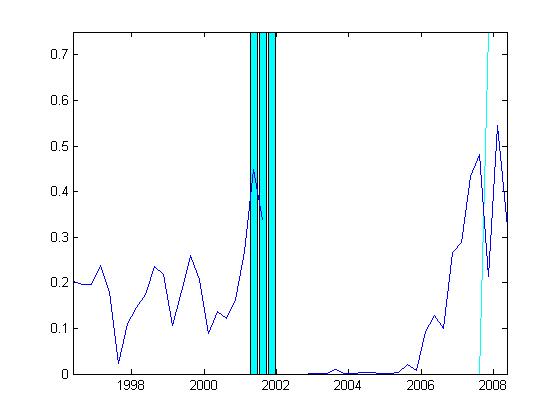
Two-quarter-ahead forecasts are shown in the first chart.
The two-quarter horizon allows us to examine how the model
predicted the first two of the three recession quarters in 2001.
Here one might assign a threshold probability
level of 35 percent, in which case the model successfully called the 2001 recession ahead of time
and it also is sounding an alarm at present. On the downside, using this metric, the model was
sounding a false alarm regarding the second half of 2007, based on data available six months
earlier. It might have been the case that the yield curve was signalling financial market upset
in the second half of 2007 instead of outright recession.
It is also worth noting that the model did not give false recession alarms in previous periods
of financial market turbulence, such as the fall of 1998.
|
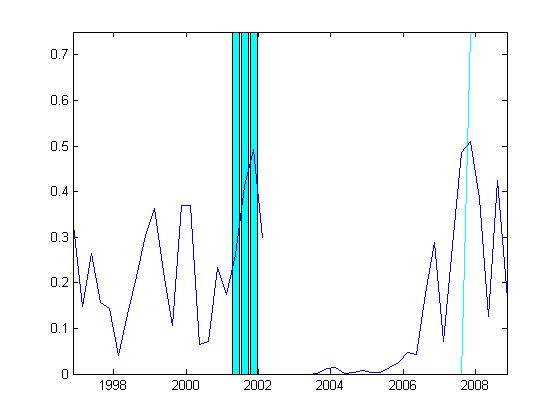
The second chart depicts the four-quarter-ahead recession probabilities.
Four-quarter forecasts help us assess whether the model was able to predict the
duration as well as the occurrence of the 2001 recession.
To avoid false alarms in the late 1990s, the threshold probability level would have
to be almost 40 percent. In this case, the
model did well in calling the second and third quarters of the 2001 recession one year ahead.
In the present case, the model called a recession for 2007Q4, using information available in
2006Q4, when it now looks likely that the first recessionary quarter will be
2008Q1. The model-implied recession probability for 2008Q1, based on data from a year earlier,
exceeds 50 percent, so it appears to be a fairly strong sign of recession.
|
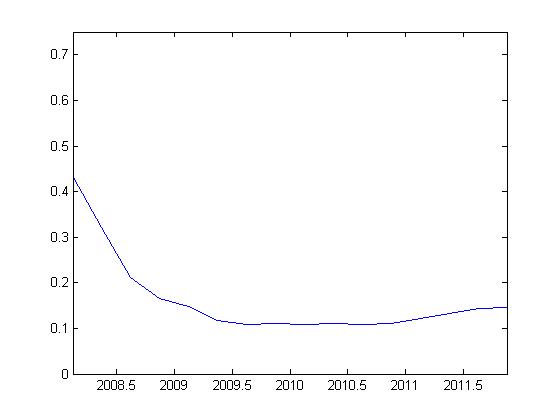
The third chart uses the model’s capability to forecast at any horizon to generate
out-of-sample recession probabilities, starting with 2008Q1. The first two quarters of
2008 are ones where the model-implied recession probabilities lie above the threshold
level of about 35 percent.
Thus, the model is calling a two-quarter recession for the first half of 2008. Note that the
model-implied recession probabilities dip down near 10 percent in the middle of 2009 and
rise gradually toward the unconditional probability of about 17 percent. The dip below
the unconditional probability is the result of a snap-back phase the economy experiences
after recessions, during which the economy is farther than normal from recessionary conditions.
|
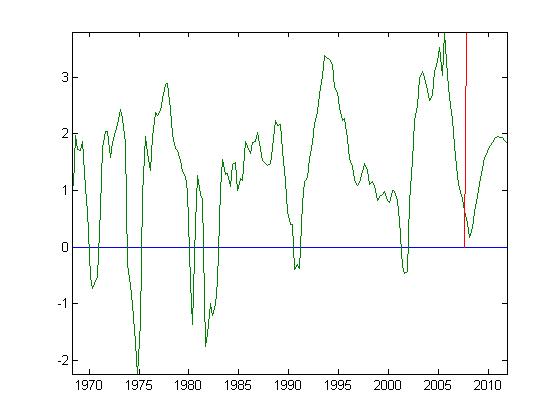
To get a handle on how unprecedented it would be for the economy to avoid
recession in 2008, it is useful to look at the business cycle index produced by the
Qual VAR model. The fourth chart shows the business cycle index for the entire
sample period with forecasts for 2008 through 2011. The chart shows that
the business cycle index has never dipped as close to zero as it is projected
to do in 2008 without a recession. For this reason, it appears unlikely
that the economy will escape the current slowdown without a recession.
|
Very nice work, Mr. Dueker. Neat, that you can predict recessions two and four quarters ahead based on four readily observable variables.
I think the first recessionary quarter is just as your second variant predicts: Q4 ’07. Just take a look at when real DPI, industrial production, real PCEs, and household employment peaked: Q4 ’07.
Thanks for sharing your work.
I’m inclined to agree that a recession seems more likely than not this year, but my comments are regarding these models themselves and not what they’re projecting.
I’ve been looking at various recession forecasting models in the last month and I’m rather unimpressed. It seems like you can fit a model to argue either side. Some of the models I’ve seen say it would be unprecedented to not have a recession and some say no recession ahead. Clearly some of them are going to be wrong despite not having been wrong before.
As for the last chart, couldn’t you also say that there’s never been a recession without the zero line being crossed? So, couldn’t one also say that it would be unprecedented if we DID have a recession based on that chart?
Again, it seems that either the “close to zero” or “crossing zero” indicator will be proven wrong.
Unprecedented events happen all the time, don’t they?
Thanks for the comments.
Steve, I take your comment to suggest that forecasters should not be able to hide behind probabilities that hover near 50 percent and then claim, for either outcome, that they were right ex post. For this reason,
I think it is important to cite a threshold probability and make clear that any probability above that level is a recession call. I cited a 40 percent threshold for my model at the four-quarter horizon.
When viewiing the business cycle index, it is important to keep in mind that, within the sample period, it has to cross zero at NBER turning points. The out-of-sample forecasts will dip below zero only when the recession probability rises above 50 percent—a rare occurrence with these models. It certainly would not be unprecedented for the economy to slip into recession when the model-implied recession probability is less than 50 percent. The threshold probability that one defines to make a yes/no recession call will lie between 30 and 40 percent in practice. My observation was that that we have never seen the index dip very close to zero without continuing on across zero.
Monthly real economic activity peaks:
Real DPI — Sep. ’07
Industrial production — Sep. ’07
Real PCEs — Sep. ’07/Nov. ’07
Household employment — Sep. ’07/Nov. ’07
Establishment employment — Dec. ’07
Q4 ’07 for recession start sure seems plausible to me.
Dr JH,
Is the recession predictor that is posted on the right side in this website showing some awfully wrong figures ?
When the reality is 90% recession, the bunny shows only low teens.
Why is economic models so far away from the reality ?
Dr. Dan, the number highlighted on our main page (7.7%) is not a predictor, but an assessment of where the economy was as of 2007:Q3.
I assume this model uses the advance 2007Q4 GDP number. I would be curious to see how current recession probabilities react to a revision in this number. Say for instance, GDP is revised downward, does the model predict a greater chance of recession? Is there any sort of sensitivity analysis applied to the model? Do changes in the steepness of the yield curve have a greater effect on the probabilities than a few quarters of weak (or strong) GDP growth? Looking at the fourth figure, precipitous declines in the business cycle index follow tightening cycles of monetary policy. The chart shows that in 1995 around the time the Fed stopped increasing the target rate the business cycle index levels out from the fall. But the August 2006 pause did not seem to have the same effect. I would contend that this result is due to the fact that the pause did little to correct the yield curve. I would think this result would suggest that Dueker’s model is more sensitive to yield curve changes than changes in real activity.
Mr. Dueker, your last chart (business cycle index and forecasts) looks almost exactly like a yield-curve I created based on Wright’s Model “B” (yield-curve adjusted for the level of Fed funds).
It, too, never crossed below the “zero” (inverted) threshold, although it did in advance of every other recession since the late-1960’s.
IMO, the crossing of that zero line is significant and not just an inconsequential math calculation where “close” is “close enough.”:)
My rationale: An inversion means a hostile investment environment, when interest rates are higher in the near term (Fed funds and T-bill rates) than the expected return in the long run (10-year Treasury rates).
No inversion, even if the yield-curve just gets “close”, means that the investment environment may be modest, but not openly hostile. And so, no recession, just a period of slower growth.
JMO.
Sebastian
JG, You are right that I did not allow the business cycle index to be below zero in 2007Q4. I am not sure that it is being held up artificially, however.
AHP, You make a very interesting observation about Fed tightening/easing cycles and the business cycle index. When I opened the spreadsheet, I saw that the business cycle index leveled out in 1995Q3, only after the Fed reversed course and eased in July 1995.
Sebastian, the question is whether one gains or loses by estimating a model with autoregressive dynamics and a business cycle index that depends on a number of variables, as opposed to a direct mapping between the current yield curve and a recession probability. As you say, at present the two approaches are not leading to the same prediction.
Just to clarify – are the 2008:Q1 forecasts jumping off at the end of 2007:Q4 (with the associated FFR of 4.25) or within 2008:Q1 (and with the corresponding FFR of 3.0)? In other words, do the predictions vary much with such a large policy change?
MMcCracken, I used the interest rate data through 2007Q4. In the out-of-sample forecasts for the federal funds rate, the rate goes down to
2.5, but it takes five or six quarters to get
to that level. For 2008Q1, the model forecast is for a 4.0 percent fed funds rate, so
it would be interesting to impose 3.0 or less
for the forecast for 2008Q1.
This is a very good study. As a long-term investment manager, I have been looking for convincing evidences that a recession had started in Dec 07 or Jan 08, not wanting to wait for NBER to make it official. This study has given me the best evidence yet. I did a study of recession and stock returns where I studied the returns of the S&P 500 index and a Small Cap Value index 1 year, 3 years and 10 years after the start of a recession.
Thank you for your insights.
This is very cool. I had wondered about VAR’s and categorical variables ever since I read about Andrew Lo’s ordered probit model.
Thanks to both JDH and MD.
New Model for Predicting Recessions
Our firm has a long history with Russell Investments , and my personal relationship with the firm goes back all the way to 1983, so I have a great deal of interest in their research.
Michael Dueker is a senior portfolio strategist at Russell and has an…
This is completely non-quantitative, but just to interject the market psychology: If enough people and business decision makers see the line in the last graph heading towards zero — and the R word gets repeated enough on TV etc– it is (again, my feeling that) the economic outlook that becomes self fulfilling as enough people pull money out of stocks, or pull proposed spending out of the budget to “wait and see”.
For me personally, I am at this site to see if I should be the brave person leaving money in stocks, or the prudent careful person who pulls out early, and does not ride the market down. It is somewhat humorous that I am ‘half out’ as of October, 2007, but I was not sure about my ‘market call’ and subsequently, I hear probability forecasts of 50% likelihood. So you -what, split the difference? Asset allocation based on recession probability? Well, that’s the best I can figure.
My whole point is that if we get close to the edge, fear of losses makes sure we go over the line. Goldman Sachs article titled Free Fallin pushes us there, e.g.
(something about ‘fear itself.’)