Some thoughts on what to make of the trade and export/import price releases.
First, a recap of what’s happened to the nominal value of the dollar, both against a broad basket of currencies, and against the major currencies.
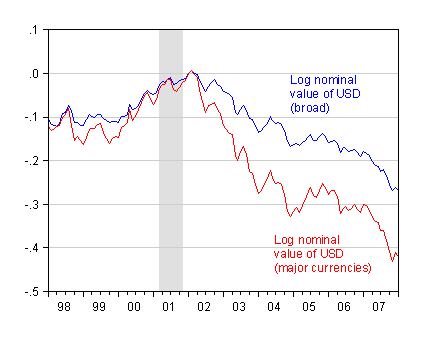
Figure 1: Nominal value of the dollar against a broad basket (blue), and against a basket of major currencies (red), in logs, rescaled to 0 in 2002M01. NBER-dated recessions shaded gray. Source: Federal Reserve Board via FRED II, NBER.
Now, in the wake of the export/import price release, there was some hand-wringing about inflationary pressures arising from increasing import and export prices [0]. My first comment is that higher import and export prices are exactly what would be expected from exchange rate depreciation. Taking the 40% pass through coefficient that I use as a rule of thumb (which one can take issue with, see [1], [2]), one should expect rising tradables prices, although the changes that have occurred since 2002M01 are a bit on the higher end, especially for exports (implied pass through of about 65%).
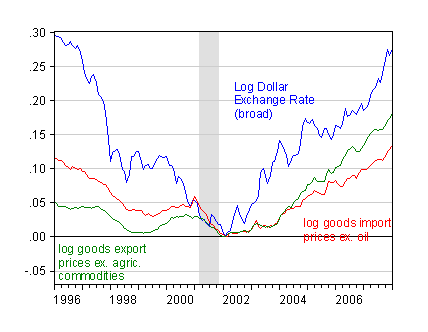
Figure 2: Nominal dollar exchange rate against a broad basket of currencies (blue), price of goods imports ex. oil (red), and price of goods exports ex. agricultural commodities (green) in logs, rescaled to 0 in 2002M01. NBER-dated recessions shaded gray. Source: Federal Reserve Board via FRED II, BLS release of 15 February 2008, NBER, and author’s calculations.
One caveat is that typical estimated pass through coefficients are of the nature of “partial derivatives”, whereas looking at pictures such as Figure 2 yields a “total derivative”.
Returning to the point that of higher tradable goods prices, it’s important to recall that this is part of the expenditure switching process — tradables prices have to rise relative to the price of the general consumption bundle in order for the trade balance to shrink, holding all else constant.
The non-oil trade balance continues to shrink (Figure 3), and indeed, I was surprised by the bump up in nominal exports in December. But one shouldn’t get too excited — one’s got to keep the big picture in mind. In particular, while real goods imports ex oil are shrinking noticeably, real goods exports ex agricultural commodities are right on trend (Figure 4).
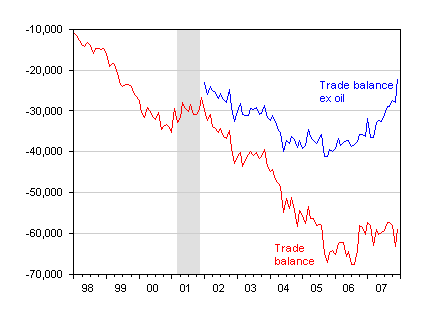
Figure 3: Nominal trade balance (blue), nominal trade balance (red), in millions of USD per month. NBER-dated recessions shaded gray. Source: BEA/Census release of 14 February 2008, and NBER.
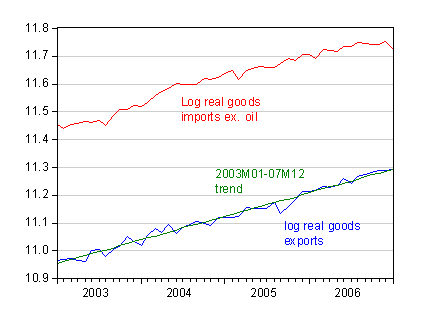
Figure 4: Real goods exports (blue), 2003-07M12 trend (green), and real goods imports ex. oil (red), in millions of 2000Ch.$ per month. Source: BEA/Census, release of 14 February 2008.
(As an aside, the oil import bill is likely to rise in January, given that the price of petroleum imports rose 5.4% in log terms in that month, compared to the 1.9% decline recorded in December. See also Brad Setser’s post on the impact of oil on the deficit)
One last observation. We wanted the Chinese yuan to appreciate against the dollar, in part to induce an increase in prices of Chinese imports. It seems that we’re getting our wish, insofar as those prices are concerned (Figure 5).
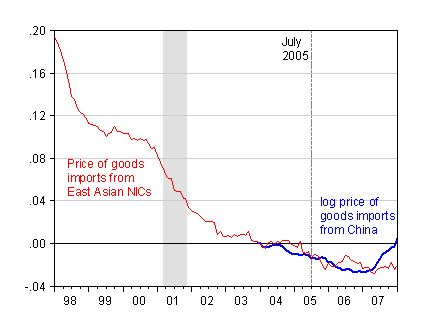
Figure 2: Price of goods imports from East Asian NICs (red), and price of goods imports from China (blue) in logs, rescaled to 0 in 2004M01. NBER-dated recessions shaded gray. Source: BLS release of 15 February 2008, NBER and author’s calculations.
So when you hear complaints about the rising price of Chinese imports (which seems somewhat overwrought [3]), remember this is part of the process of “global rebalancing”. It, too, should not be a surprise.
To summarize:
- Exchange rate pass through seems a little higher than that exhibited in recent history, although confirmation awaits formal econometric estimation.
- Tradables prices should rise, and should rise relative to the overall price level. Rising tradables prices should more plausibly interpreted as a manifestation of monetary policy-induced inflationary effects, rather than a cause of inflation, unless the rising prices are caused by rising costs in the exporting countries.
- The export surge is not so evident in real terms, insofar as goods are concerned.
Technorati Tags: trade deficit,
imports,
exports, pass through,
dollar.
In the “broad” basket of currencies, do you know how many are pegged (more or less) to the dollars, or perhaps a better question might be what percentage of imports are from countries that peg to the dollar?
Robert Bell: Hard to say, since “pegs” are to some extent in the eyes of the beholder. E.g., are crawling pegs “pegs”? The Fed provides all the information you need to make your own judgments based upon your definitions of exchange rate regimes; see here. De facto currency regimes can be found
here (this is the Levy-Yeyati/Sturzenegger definitions).
Menzi,
Nice article. There is one thing that is not consistent with the “expenditure switching” story in Figure 2: the price of imports relative to exports decreases when the dollar depreciates, though it is supposed to increase. It may look better if you include oil and other commodities in imports and exports. Anyway these price indexes are subject to other caveats such as quality adjustment.
Jian: Thanks. Yes, thre are numerous caveats associated with the use of these price indices. One big one with respect to China can be highlighted by examining the following equation.
d(pimp) = d(s) + d(cexp) + d(pmgn)
where d(.) is the difference operator, s is the log exchange rate, cexp is the production cost of exports and pmgn is the log profit margin, and I’ve suppressed lags. Given rapid productivity growth in Chinese manufacturing, I’d not be surprised to see dollar import prices of Chinese goods falling even as the yuan appreciated against the dollar. I’m sidestepping issues of the dollar denomination of imported components being used in Chinese exports (i.e., vertical specialization and/or the fragmentation of the supply chain).
An excellent post. One thing, though, I wonder how appropriate it is to exclude U.S. agricultural exports. I know this is traditional and there is some noise in these data, but the recent trends appear strong and likely to persist over the long haul. It is sort of like the federal reserve using prices ex-oil and ex-food as their preferred measure when targeting inflation. The practice will put them behind the curve when long-run trend movement in the excluded prices is higher than other prices.
One more thought – Is the yuan a “major currency”? I wonder what the graph would look like with Asian currencies and trade balances shown separately.
Don: You can download the data from the BLS website. Using a 2000=0 base, the log difference between the all-goods and the goods-ex-agricultural commodities export indices is only 3.5%.
The yuan is not in the major currencies basket (see this link). I don’t know the answer to your second question, but you can calculate it yourself using the Fed weights.