Some people have the impression that financial capital zips to wherever the returns are highest. Maybe that’s the case. But I’m not sure.
Recall that one of the definitions of financial capital mobility is that the expected rate of return on securities of identical maturity and default characteristics, when expressed in a common currency, is equalized. This condition is called uncovered interest parity [1], [2] [pdf].
In practice, one can think of several reasons why this condition does not hold for emerging markets. Consider the foreign country as the US, and the home country the emerging market. Then:
(i-iUS) = [(i-iUS)-(f-s)] + [f-E(s[+1])] + [E(s[+1])-s] (1)
Where:
- (i-iUS) is the interest differential
- f is the log forward rate, s is the log spot exchange rate
- (f-s) is the forward discount, the log difference between the forward rate and the current spot exchange rate
- [(i-iUS)-(f-s)] is the covered interest differential
- [f-E(s[+1])] is the gap between the forward rate and the spot rate expected in the future
- [E(s[+1])-s] is expected depreciation
The covered interest differential is non-zero when there are capital controls, or the threat of the imposition of such controls. That’s why this is sometimes called “political risk”. The gap between the forward rate for a transaction k periods hence, and the spot rate expected k periods hence is sometimes called the “exchange risk premium”. Rewriting:
Interest Differential = political risk + exchange risk + expected depreciation
It would be nice to decompose the interest differential into these component parts. Unfortunately, we don’t always observe the forward rate in these emerging market. More importantly, we don’t observe expected depreciation. Hence, we can only address issues of ex post interest rate parity.
Rearrange the first equation, and use the ex post realization of the exchange rate, s[+1]:
(i-iUS) – [s[+1]-s] = [(i-iUS)-(f-s)] + [f-s[+1]] (2)
Readers will recognize the substitution of the ex post exchange rate for the ex ante expected exchange rate as the implementation of the rational expectations methodology, namely that the ex post differs from the ex ante by a random disturbance term (this is implied by rational expectations in a steady state equilibrium).
Notice if political risk and exchange risk were zero, and expectations were unbiased, then in the regression:
[s[+1]-s] = b 0 + b 1 (i-iUS) + error (3)
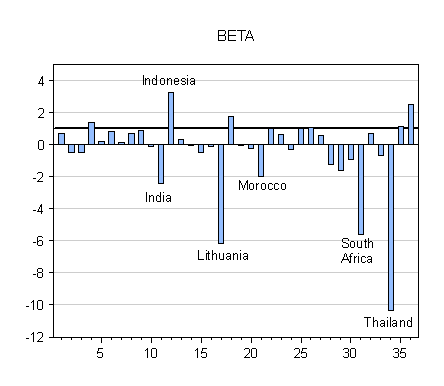
the estimated coefficient b should not be statistically different from unity. As it turns out, our estimated b‘s are typically far from unity.

Figure 1: Beta coefficients from Fama regressions, estimated by OLS, for emerging market economies. Source: Ito and Chinn (2007) [pdf].
In the above graph, the big negative coefficients are all significantly different from unity; and indeed some of the smaller ones are also significantly different as well. One could relate the magnitude of these parameters to various factors.
In Ito and Chinn (2007) [pdf], we take a slightly different tack, and examine the empirical determinants of the absolute value of the left hand side variable in equation (2) (call it ADEV), for emerging markets. We find the following:
ADEV = 0.038(y) – 0.043(pi) + 0.245(sigma) – 0.016(findev) – 0.015(kaopen) – 0.080(BuS) – 0.008(open) – 0.009(legal)
Where y is per capita income, pi is inflation in the emerging market, sigma is inflation volatility, findev is financial development, kaopen is capital account openness as measured in the Chinn-Ito index, BuS is the budget balance to GDP ratio, open is trade openness measured as exports plus imports to GDP, and legal is an index of legal institutional development; and N = 213, Adj-R2 = 0.21, and coefficients in bold face denote significant at the 10% MSL. The unbalanced sample of annual data includes the following countries: Argentina, Brazil, Bulgaria, Chile, China, Colombia, Croatia, Czech Republic, Estonia, Hong Kong, India, Indonesia, Israel, Kazakhstan, Kuwait, Latvia, Lithuania, Malaysia, Mauritius, Mexico, Morocco, Nigeria, Peru, Philippines, Poland, Romania, Russia, Singapore, Slovak Republic, Slovenia, South Africa, Sri Lanka, Taiwan, Thailand, Turkey, and Venezuela.
What’s interesting is that capital account openness and greater financial development — measured as a composite of various indicators of financial market size and activity — causes a statistically significant reduction in the size of these absolute deviations. Greater inflation volatility, measured as the standard deviation of monthly changes, increases the size of the deviations. Strangely, higher per capita income (hence closing the income gap between the home country and the US) results in higher absolute values of the interest parity deviations; however, since higher per capita income is usually associated with greater financial development and capital openness, the net effect might be to see smaller deviations
The bottom line: financial globalization may have proceeded far among the industrial countries, but for the emerging markets, there still appear to be some impediments to the free flow of financial capital.
[Late Addition: 12:38 Pacific]
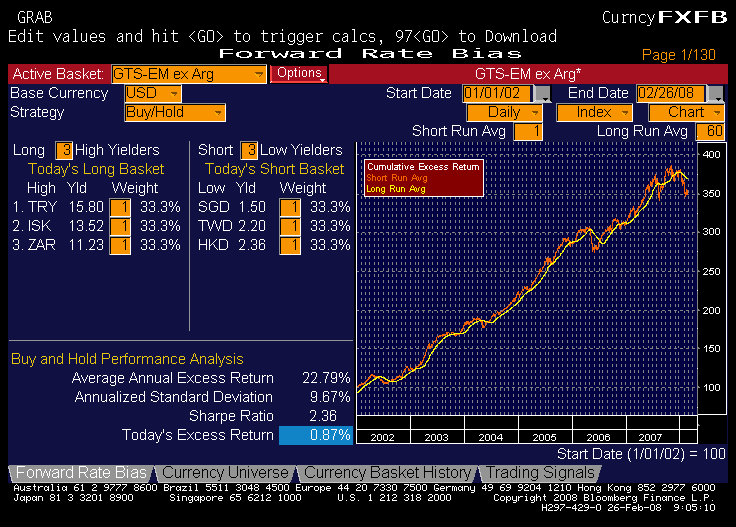
Mike Rosenberg at Bloomberg sends me this snapshot which “…shows the cumulative return on a forward rate bias portfolio restricted to EM currencies. The chart shows the return on a strategy that goes long the three highest yielding EM currencies and funds that position by going short the three lowest yielding EM currencies. As you can see the returns on that strategy since 2002 have been quite impressive.”

Source: Pesonal communication from Michael Rosenberg, Bloomberg.
From my perspective, this is of interest because it shows that there are profit opportunities that can be exploited because of these deviation. Whether those profits are worth the risk depends upon one’s risk aversion, time horizon, etc.
Technorati Tags: interest rate parity,
exchange rates,
capital mobility,
capital controls.
toh…
The free flow of financial capital is the main cause of the mess we re in.
Funny to call “expected depreciation” when everyone expects the emerging market currencies to appreciate against the dollar. See their rising reserves.
all this paper is bogus when most of the flows are now made by public agents seeking to boost the exports of their home countries and not from private agents seeking the best returns.
Try to explain the differential in interest rates by the differencial in reserve accumulation, it ll probably work better.
see http://www.rgemonitor.com blog of Brad setser.
Menzie,
I refer you back to your risk calculations, “Interest Differential = political risk + exchange risk + expected depreciation.” I submit this will trump most other factors, except for those who are actually gambling.
I have to admit I am way out of my field here and am only reacting to the most obvious factor(s).
df: OK.
CoRev: Equation (1) and the equation you cite are decompositions, true by definition. In that context, I’m not certain what “this” is that will trump most other factors. Do you mean “political risk”?
I refer to ALL the risks associated with the equation. Or really the overall risk of loss with investing with emerging markets.
CoRev: I see. Yes, this is probably true for currencies where inflation is particularly low, especially over this sample period.
I always learn something interesting here, Menzie. Thanks.