In a recent paper, David Greenlaw, Jan Hatzius, Anil K Kashyap, Hyun Song Shin exposed us outsiders to the inside workings of those estimates we see of how the credit crunch affects output. The paper, entitled “Leveraged Losses: Lessons from the Mortgage Market Meltdown”, was widely covered ([1], [2], [3], Calculated Risk, Big Picture) but I still think that the conclusions, as well as the methodology, bear some repeating for emphasis. And in any case, it’s a long paper, and different people have focused on different aspects.
Essentially, the authors trace how the souring of so many mortgage loans resulted in elimination of equity capital in the leveraged financial institutions in the economy. Assuming some injection of new capital (think of injections into Citibank, for instance [4]), and some deleveraging as institutions try to build in a cushion of capital, and one sees easily enough a reduction in lending, i.e., the asset side of the balance sheets shrink.
The final step in the chain is to see how reduced lending leads to decelerating economic growth.
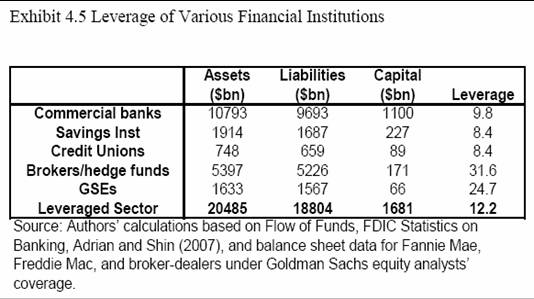
I can’t do justice to the entire paper, but I can highlight a few choice bits. The first aspect I want to highlight is the characteristics of the financial sector (what’s called the leveraged system in the paper), such as the size of the balance sheets, and in particular how much equity capital there is.

The authors begin with an estimate of the losses falling on the leveraged system (the total losses are estimated at twice the size of that on the leveraged system).
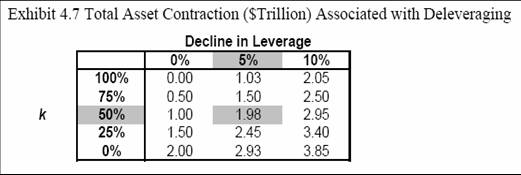
Our baseline scenario (marked in grey) is that leverage will decline by 5%, and that
recapitalization of the leveraged system will recoup around 50% of the $ 200 billion loss
incurred by the banking system. Under this baseline scenario, the total contraction of
balance sheets for the financial sector is $1.98 trillion.
Although the degree of recapitalization is uncertain, it is notable that our estimate for the
contraction of balance sheets is not particularly sensitive to the choice of k. For instance,
if k were to turn out to be 25% rather than 50%, the contraction would be only somewhat
larger (at $2.45 trillion) than our benchmark case. Alternatively, if k were to turn out to
be 75% rather than 50%, the contraction would fall to $1.50 trillion.
Calibrating the baseline estimate for the change in leverage is more challenging. As
shown in both Exhibits 4.1 and 4.2, there have been occasions in the past when the
leverage of intermediaries has shrunk by more than 5%. One reason for choosing this as
the reference point is the “lending against their will” phenomenon noted earlier. Because
leverage actually increased for both large investment and commercial banks during the
third quarter of 2007, some of the contraction from that point forward is required just to
move back towards the target value that had obtained before the crisis. Given the more
than 50% increase in Value at Risk relative to a year earlier, the 5% assumption strikes us
as conservative. But this baseline is admittedly arbitrary. Unfortunately, as can be seen
by scanning across any row in the table, the implied size of the contraction is more
sensitive to this assumption than to the one on k.
The various calculations, with the baseline highlighted in gray, are shown in Exhibit 4.7.

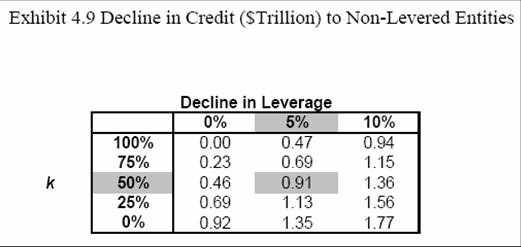
Now, as they point out, there’s double counting of assets and liabilities in financial sector, so one needs to figure out what is the shrinkage in leveraged system’s assets with respect to the nonfinancial sector. The baseline estimate is $0.91 trillion.

The linkage between domestic non-financial debt (DNFD) and economic output is estimated, in an admittedly ad hoc, but not unreasonable fashion, using an autoregression in GDP growth rates, augmented with 4-quarter growth DNFD. From this, they obtain this conclusion:
As a back of the envelope calculation, we can use the estimate from Exhibit 5.2 along
with the potential $910 billion contraction in end-user credit to calculate a GDP effect
from the deleveraging. This contraction is equivalent to a 3.0-percentage-point drop in
DNFD growth. The results in Exhibit 5.2 imply that this corresponds to a hit to real GDP
growth of 1.3 percentage points over the course of the following year. This impact
should be viewed as additive to the impact of housing on real GDP growth via other
channels, such as the decline in residential investment and any potential wealth effects
tied to falling house prices. We emphasize that the calculation is very rough, and should
be viewed as quite speculative. But, it does suggest that the feedback to the economy
from the deleveraging could be substantial.
In our estimate of the impact on GDP, we have taken account only of the contraction of
end-user credit to borrowers outside the leveraged sector. However, the diminished
activity of the leveraged institutions and other entities involved in the securitization chain may well have an effect on GDP more directly through employment and other real
decisions. We have not included such effects here, and so our estimates of the impact on
GDP should be seen as being conservative.
In my view, this is a very sober — and sobering — paper. Especially if you think that losses might exceed $400 billion…(see e.g. Calculated Risk, again). Oh, and by the way, these are only mortgage losses. Yet to be realized losses on auto loans, credit cards, and commercial real estate are of course not in these calculations.
Technorati Tags: deleveraging, mortgages,
balance sheets,
equity capital,
bank lending, capital crunch,
credit crunch.
Of course this is why Paulson has been all over the wires begging residential property debtors to please, please, please not default, even if it is in their immediate interests to do so.
However, the outcome of all of this will ultimately be determined in the infamous CDS realm, where the numbers dwarf all of the other items combined.
And there, it appears that no reasonable analysis is even possible yet.
Perhaps, “this time its different” gets to carry the argument for a change.
Menzie, I agree that it’s sobering, BUT: it’s important to keep in mind that we do not have to allow the de-levering. It’s happening because of political myopia, not because of some irrevocable economic law.
If this were 1936, we would simply pay a few years of resets for non-speculators until inflation made the burden acceptable, let speculators eat their losses, prosecute anyone who committed fraud, and tax the malefactors of great wealth in proportion to their malefaction. As long as people are in their houses and making substantial payments, the real economic damage is not done.
I am unfamiliar with this type of analysis, but it looks like much of the important stuff is left to be determined. For example, aren’t the bank losses and ‘k’ related? If bank capital were kept up, but the limit on loans was set by the ability to find willing, credit-worthy borrowers, wouldn’t leverage just decline to offset the increase in bank capital? I ask, because it seems that the demand for loans by credit-worthy borrowers must be a limiting factor sometime, and a critical thing to know when estimating what will happen to total borrowing. Personal saving has been negligible for some years. Responsible people must be asking themselves how they will pay back loans. In other words, at some point, consumers would become tapped out, even if home prices were not declining and credit conditions were not tightening. This would leave only the federal government as a source of borrowing to keep up the current level of excess demand for the economy a whole.
Charles said:
It’s important to keep in mind that we do not have to allow the de-levering. It’s happening because of political myopia, not because of some irrevocable economic law.
It is not political myopia that is letting the de-levering happening but a synchronization issue. The risks have been sliced and diced and spread around to so many investors with competing interests that co-ordination is all but impossible.
Don says:
“Personal saving has been negligible for some years. Responsible people must be asking themselves how they will pay back loans.”
How often do responsible people find themselves in illiquid positions?
Gavin, Kathleen Howley of Bloomberg has a story up in which the National Taxpayers Union states that taxpayers will pay up to $50B this year on costs from 1 million foreclosed properties.
Now, $50B is a lot of money. We could afford to pay $500/month *for five years* on every one of those mortgages– and still pay only about *half* of what NTU says we will be stuck with. (After 5 years, 3% annual inflation should have reduced the mortgage burden to tolerable levels)
If the borrowers are paying their mortgages, the lenders can pay their creditors, and the derivative securities can gradually be unbundled, restoring transparency. You only need coordination if you focus on creditors. If you focus on borrowers, it is all incredibly simple.
I say again: the problem is myopia. Reactionary ideology has so gripped this country that we are no longer able to think our way through problems. The only solutions we allow ourselves to think about are those which will further damage the country as a whole.
From Reuters:
Economic Effects of Subprime, Part II : Distribution of Exposure
In the comments to my post Is the US Banking System Really Insolvent? Prof. Menzie Chin brought to my attention a wonderful paper: Leveraged Losses: Lessons from the Mortgage Market Meltdown.
This paper has also been highlighted on Econbrowser under th…
you forgot one more thing. the paper also ignores, for reasons of tractability, losses on prime mortgages.
There is one more issue that comes up in the paper: the surge in the sub-prime mortgages from 2004. That is when the Fed began its “calibrated”, “measured” and telegraphed rate increases of 25 bp. each.
Does such transparency help or did it hurt? In any case, we know that the Federal Reserve or any central bank can never be fully transparent.
For instance, can they disclose or have they disclosed all that they know now about US banking system so that we all understand the risks better?
I think the paper, in that sense, also re-kindles the debate on what exactly ought to be components of monetary policy transparency. Or, even better, is it required at all?