The Bureau of Economic Analysis reported today that U.S. real GDP grew at a 0.6% annual rate in the first quarter of 2008, the same tepid growth rate we saw in the fourth quarter of last year.

|
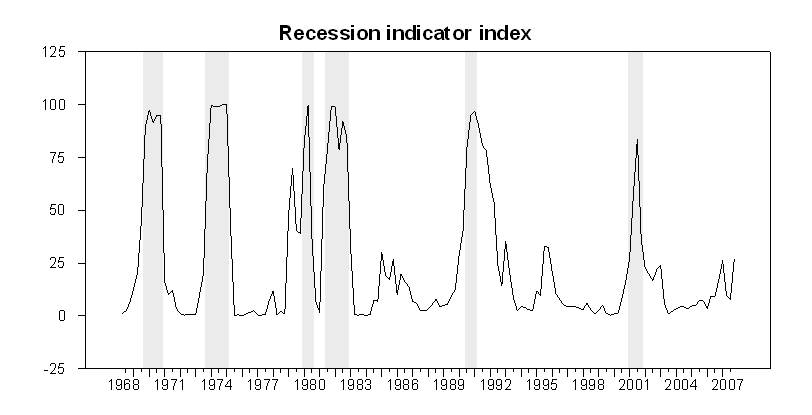
Recent sluggish growth rates bring our recession indicator index for the fourth quarter of 2007 up to 26.9%. That’s its highest value since the 2001 recession, but still well short of the 65% reading that we require in order to make a declaration that the U.S. economy had entered a recession as of 2007:Q4.
This index is calculated from a simple pattern recognition algorithm that interprets moves into and out of recession as a key determinant of GDP growth rates. It is slightly more sophisticated than the traditional rule of thumb that designates two quarters of falling real GDP as a recession, though either approach would lead you to the conclusion that a recession had not yet started as of the fourth quarter of last year. Note that our index is always looking backward one quarter; we’ve used the just-released advance 2008:Q1 estimates to inform our assessment about 2007:Q4. The historical performance of the index suggests that given the likelihood of data revisions and the usefulness of subsequent information, it is prudent to wait a quarter before making a declaration about what the data signify. More background on how the index is constructed can be found here.
I believe there is an important benefit to having a purely objective, data-based algorithm for making these declarations. The numbers are reminding us that if, for example, the tax rebates were to keep GDP growth positive in the second quarter, we would end up characterizing the most recent experience as a period of slow growth rather than a typical economic contraction.

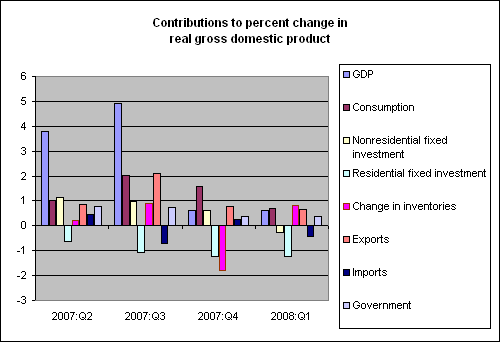
In terms of the specific details behind the 2008:Q1 numbers, housing remains the big story. If there had been no growth in any other category, the fall in housing would have been enough by itself to produce a 1.2% decline in real GDP. As it was, three other components– consumption, inventories, and exports– made modest positive contributions that were sufficient to offset the drag from housing and leave us with positive overall economic growth. We’d normally expect a much bigger contribution from consumption spending than the observed +0.7%, because personal consumption expenditures alone account for about 70% of the level of GDP. It appears that lost housing wealth and consumer confidence are important factors behind the sluggish GDP growth. Inventory accumulation also contributed +0.8% to 2008:Q1 real GDP growth, meaning that real final sales actually declined in the first quarter– not a good sign of economic health at all. Nonresidential fixed investment contributed -0.3%; a small factor in the total, but a development that worries Calculated Risk. The one cheerful note was the +0.2% contribution of net exports, one benefit perhaps of the sagging dollar.
Not a great quarter at all, but nevertheless better than many of us had been fearing.
Technorati Tags: GDP,
recession probability,
recession indicator index,
macroeconomics,
economics
I continued reading until I discovered the gains were increases in government expenditures.
Like last 4q 07 gdp report, the deflactor used is not credible.
Falling home prices; all-time high vacancies; skyrocketing defaults and foreclosures. These all ‘hint’ that the value of housing stock is falling.
Once again, the GDP report shows a positive contribution to GDP growth from ‘housing services.’
Professor, for a capital asset that is falling in price and for which there is excess and growing supply, how in the world can you have a rising imputed rental value?
jg,
Why would the falling prices impact real activity?
Every major investment category contracted. Durable and non-durable goods consumption contracted. Real final sales and real final sales to domestic purchases fell. So glad that GDP rose – at the slowest 2-quarter pace since mid-2001.
There is no indication of a recession from my point of view. It was clear years before.
http://inflationusa.blogspot.com/2008/03/no-recession-in-2008-and-2010.html
Just for a record, when you will discuss 2010 recession indicator – no recession as well.
A question.
When they set a Real GDP growth number what are they using for Inflation?
Give a man a fish and you’ll feed him for a day.
Teach him to fish and he’ll deplete his food supply.
What might be interesting is if you could simulate what it would take in Q2/A3 for you to retrodict that in Q1 we were in a recession? Maybe some scenarios for various possible GDP growth/contraction rates over the next two quarters, or revised GDP growth rate for Q1?
Steve, I do not say that falling asset prices impact real activity. I think that falling asset prices REFLECT falling real activity/value.
To my simple mind, the price of an asset reflects the discounted value of its future economic stream. For a house, the stream is ‘imputed rent.’
We see that home prices are falling. Thus, it seems to me, this implies that imputed rents are falling. The BEA disagrees, obviously, as they have ‘housing services,’ i.e., imputed rent, rising.
jg,
I’m not exactly sure what you’re taking issue with. Are you expecting housing services to decrease in real terms? If so, why? Are fewer people renting? That would seem unlikely given that our population is still growing.
Are you taking issue with nominal housing services increasing (it doesn’t sound like you are). In that case I assume it’s because the nominal increases due to population growth exceeds any nominal decreases due to decreases in imputed rent.
“The one cheerful note was the +0.2% contribution of net exports, one benefit perhaps of the sagging dollar.”
I’d hardly call that cheerful. Given the weak dollar and an expanding economy, that’s not very good. Net exports added a point to growth in Q4, and 0.8 over all of 2007. If we only get 0.2 from exports in Q2, I don’t see how we avoid a contraction, because there’s no way you’ll get that big boost from inventories.
Noticed the huge inventories turnaround as well (from -1.8 to +0.8). Not a good sign going forward if the consumer is going away, which he/she is.
Also, the 3.5% GDP deflator is highly suspicious. Gas and food were already on the climb by the end of March, so is this an average of the three months, or is it just comparing Dec. 31 prices with March 31 prices?
That should be “an expanding global economy”.
Interestingly, the recession probability indicated by the futures contract on http://www.intrade.com has collapsed to 34.9% from 75% a few weeks ago. The contract traded earlier today at around 25%, very close to the JDH indicator. The contract is based not on the NBER’s definition, but on “two consecutive negative quarters of GDP growth.”
FWIW, The Big Picture calls it a rigged game.
The GDP Litmus Test
Unless you do your own economic forecasting, you are a consumer of economic data. Where do you shop? The Data The preliminary report of first quarter GDP showed an increase of 0.6%. Taken on its face, this is very low
Jake Miller: Anecdotal ground floor evidence points to retaillers shrinking their inventories in the last 2 months. (The inventory in question is health-care-related so you could characterize it as “semi-discretionary.”) Also, consumer patterns reflects attempts to economize, not just in the amount spent, but in the choice of products and package sizes.
There’s a lot of fog around these macro statistics, but I think specific marketing data is reflecting the bearish view of the economy.
I’d love to see a comparison to GNP — how much of our gains are from profits generated by US businesses overseas, vs vice-versa?
That might give some insight into the outlook for the US job market and our future productivity, etc.
These numbers provide less and less clarity as they stall or flatten. That .6% growth in GDP is not technically in recession is a fine point unappreciated by 7 1/2 million unemployed or the 650,000 families in foreclosure. Nor would the flat or slightly increased sales from enterprises whose jobs have been shipped overseas give a true reading of the effect on Americans. Nor of the families whose health benefits have disappeared because of the belt-tightening measures taken by their employers.