The 0.6 ppt growth rate (SAAR) reported in the 2008Q1 advance release seemed to validate the President’s assertion that we’re not in a recession, discussed in this post.
Jim has discussed the release in depth, so there is not much to add. Although,the fact that inventory accumulation — at 0.81 ppts — more than accounts for total growth at 0.6 ppts is a little disquieting.
What I’d like to reiterate is that this is the advance release. As I observed back in August 2006, one doesn’t usually know whether one’s in a recession or not because the data are subject to so much revision. From “Could it be that we’re already in a recession? Lessons from the last episode”:
It’s useful to recall that, not only are almost all macroeconomic series announced with a lag, NIPA announcements are also are revised twice after the first announcement (“advance”, “preliminary”, “final”). There is also a comprehensive annual revisions that go back several years that occur in July. the NIPA announcements provide information on the size of the revisions (mean change, standard deviation). The latest NIPA release of July 28th reports that the standard deviation of revisions from advance to final is 0.4 percentage points on an annualized basis; and 1.0 from advance to latest.
Compounding the difficulties associated with tracking the cycles in the economy, these revisions appear to be larger around turning points. Recalling the the period before the last recession (dated by NBER Business Cycle Dating Committee asJanuaryMarch 2001 to November 2001), I thought it would be useful to compare the data of the time against what we now think are the measures of macroeconomic performance.
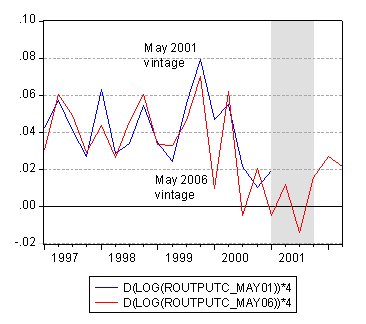
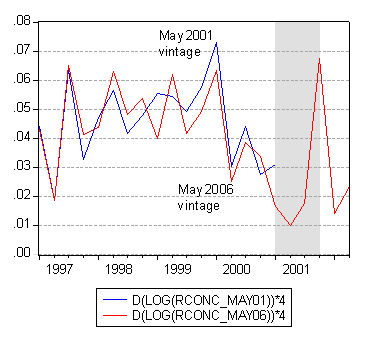
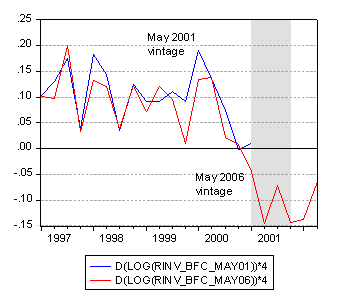
Figures 1-3 denote the annualized growth rate (in log terms) of real GDP, real consumption, and real business fixed investment; the blue (red) line is the May 2001 (May 2006) vintage of data as provided by the Philadelphia Fed’s realtime database.
Figure 1: Annualized quarter-on-quarter growth rate of real GDP (in log terms). Source: Philadelphia Fed’s realtime database, St. Louis Fed, and author’s calculations.
Figure 2: Annualized quarter-on-quarter growth rate of real consumption (in log terms). Source: Philadelphia Fed’s realtime database, St. Louis Fed, and author’s calculations.
Figure 3: Annualized quarter-on-quarter growth rate of real business fixed investment (in log terms). Source: Philadelphia Fed’s realtime database, St. Louis Fed, and author’s calculations.
As can be seen from these figures, growth rates were revised downward as more data were incorporated into estimates of macroeconomic aggregates. ….
I recall in May of 2001, looking at the GDP numbers and taking solace from the preliminary 2001Q1 growth rate (which, if you look carefully at Figure 1, was positive). Subsequent data revisions cast a substantially different light on the situation (i.e, that growth rate for 2001Q1 was later negative). The lesson I took from that experience was that a bit of circumspection is a good thing.
Technorati Tags: recession,
GDP,
consumption,
business fixed investment,
industrial production.


We have read that many people for many years were using their homes as ATM machines, and that this process has ended. So it has been puzzling that there has not yet been a more significant reduction in consumption. Your analysis may explain this puzzle.
Someone from linear estimation theory would say that you got the first estimate of system parameters with N degrees of freedom, and passed the residual on down the line for an estimate of the parameters at N+1 degrees of freedom. To get the extra degree of resolution, the number of updates required increase by NlogN, as each subservient production function goes through its updates.
Least square adaptive filters see this pattern, and it is similar to the monetary shock theory of exchange rates recently posted below. An initial innovation in money utility causes a round of reverberating updates to subservient production function.
Production functions estimate their parameters by inventory operations, so the reverberation effect is precisely instability in economic output.
With the income data reported this morning we now see hhe monthly change in real PCE for the last four months.
dec -0.1
jan…0.1
feb…0.0
mar…0.1
I’m willing to bet that all of the growth in real PCE over this period stemmed from the imputed value of housing services and medical services — these two items normally accounted for over half of real PCE for services.
Here come the revisions….
First-Quarter GDP May Be Revised Up
Thanks Menzie Chen for sharing your informative ‘circumspection’ with us.
I agree that the relative significance of inventory accumulations is cause for concern.
It occurs me that with some tedious effort one could construct crude confidence intervals for GDP estimates. I suspect that the right graphical presentation would make quite an impression upon a lay audience, and likely surprise many economists who may have little call to pay attention to national accounting issues.
I think a recession began in December 2007, but is so steep and short that the bottom will happen in May or June, and we will be in strong recovery by the fall. This is bad news for Democrats.
Tood,
You don’t inform the rest of us very much by offering an assertion about the future. What makes you think the recession will be steep and short? Your final line makes me worry that you may have started with the political implication and worked backward to the economic forecast.
It might help to know that in most US national elections (though not in all recent ones) economic conditions 6 months prior to the election have been highly predictive of election outcomes, far more so than conditions closer in time to the election. If that proves true this time, it is conditions this month that will matter for the election outcome.
Yup, no way is this recession “steep and short”. Right now it is long and shallow.
Slow decline, but steady. Next phase down is evident in April. The key is whether the 2nd half of 2008 is a black swan. That would signal a major deflationary environment at hand.
Yup, no way is this recession “steep and short”. Right now it is long and shallow.
It wasn’t like Q1 or Q2 ’07 had much in the way of growth. 1.6%, woo hoo.
The last year plus has just been substandard, growth wise.
I wonder if the rest of the year will play out like ’07? Q3 ’07 was good, the rest of the year, not so much.
Typical RE downturn. Slow, slow and slower.
Right now, we have a typical cyclical recession. The big areas that powered the expansion(RRE,CRE) are contracting. The rest of the economy can’t quite make up for it so it leads to bad local economies, statewide recessions and rising unemployment nationally.
If you look at US growth, it peaked in the first half of 2006 and has been on a slow, fairly steady decline minus a few “bumps”(ala Q3 2007) since Q3 2006.
The key thing is whether it stays cyclical(RRE,CRE and its businesses it effects) or we start getting more structural and damage throughout the economy ala mid-70’s, early 80’s.
Back to the author’s charts. This is great work.
If subsequent revisions are late arriving inventory updates, then the update pattern should go as power law, an energy cycle. Inventory operations reach maximum moving toward the right, and any request for increase estimate results in the NlogN increase in updates.
Starting from the left top, we set potential energy, and over the revision cycle this potential becomes kinetic in the form of updates by inventory operations.
So, markets will often look just like Hamiltonian energy cycles. At the edges, and initial estimate almost never matches the plan, so at the end we do not have the quantum amount of resources to get the next Nth update, and we have to go through a reset to the N-1 rank.
revision are slightly more complex – the past is not well predicted:
http://www.bea.gov/scb/pdf/2008/02%20February/0208_reliable.pdf –
” The Bureau of Economic Analysis (BEA) prepares quar-age of the final estimates for each quarter of the previous terly and annual estimates of gross domestic product year; this estimate is prepared and released in March with (GDP) and gross domestic income (GDI). It prepares the final estimate for the fourth quarter of the year. (In three current quarterly vintages of GDP estimates years with annual revisions, the quarterly estimate of the advance, preliminary, and final estimates. The advance first quarter of the previous year is from the first current estimates for a quarter are released about a month after annual estimate released the previous summer.) The cur-the quarter ends. The preliminary estimates for the quar-rent annual estimates for 3 preceding years are revised as ter are released 2 months after the quarter. And the final part of the annual NIPA revision. After the third annual estimates are released 3 months after the quarter. In addi-revision of the estimates for a year is released, these estition,
as part of the annual NIPA revision release in July of mates are not revised or released again until the next each year, the quarterly estimates for the 3 preceding comprehensive benchmark NIPA revision. years are revised. Annual NIPA revisions are superseded by comprehen-
For GDI, BEA prepares a fourth vintage of quarterly sive NIPA revisions, which occur about every 5 years. estimates. These revised estimateswhich incorporate These revisions incorporate changes in definitions and data from the Quarterly Census of Employment and classifications as well as methodological changes. The Wagesare released with the preliminary estimates of most recent comprehensive benchmark revision was GDP for the succeeding quarter. These revised estimates released in December 2003; it featured revised annual are available beginning with the estimates for the first estimates for 19292002 and revised quarterly estimates quarter of 2002. for 19472003. The latest available quarterly estimates
BEA prepares four vintages of current annual esti-are the comprehensive benchmark estimates for 194799, mates for a yearthe sum of finals and the first, second, third annual estimates for 20002004, second annual and third annual estimates. The sum of finals is an aver-estimates for 2005, and first annual estimates for 2006.”