Two years ago, as part of a multi-year project, Charles Engel and I organized a conference on current account sustainability in major advanced economies.
Lask week, we convened a follow-up conference aimed at updating our knowledge on this subject. Below is the latest read on the U.S. current account to GDP.
Figure 1: Current account (blue), net exports (red) and net exports ex. oil (green) to GDP ratios. Source: BEA GDP advance release of 30 April 2008.
The agenda for this year’s conference is here. Economists from the Federal Reserve System, the European Central Bank, the IMF,
and universities (Harvard, Columbia, Virginia, European University Institute, USC, as well as Wisconsin) participated.
Steve Kamin started off the conference with a paper entitled “How Long Can the Unsustainable U.S. Deficit be Sustained?” (coauthored with Carol Bertaut and
Charles Thomas). In the paper, they investigate the prospects for the U.S. current account
deficit, examining in particular how long it will take for measures of external
debt and debt service to reach levels that could prompt some pullback by global investors (if ever).
They address these issues using projections from a detailed partial-equilibrium
model of the U.S. balance of payments. Under plausible assumptions of income at home and the rest of the world, the current account deficit will resume widening and
the negative NIIP/GDP ratio will continue to expand. However,
even by the year 2020, the negative NIIP/GDP ratio will be no higher than it is in several
industrial economies today, and U.S. net investment income payments will remain very low.
They also examine the issue of sustainability from the perspective of portfolio holdings. They conclude that it
would take many eyars for the U.S. debt to cumulate to a level that would test global investors’ willingness to extend financing.
A somewhat different perspective on exactly how the U.S. accounts stand is provided by a paper presented by Frank Warnock. In “Current Account Sustainability and the Relative Reliability of the International Accounts,” coauthored with Stephanie Curcuru and Charles Thomas, they conduct a forensic analysis of the gaps in the U.S. international accounts, in order to determine why there is a gap between the cumulated current account and the net international investment position. They conclude that a closer examination of the data suggests that there is little evidence of an exorbitant privilege within asset classes, save for FDI. Hence, current account sustainability assessments predicated on the existence of dark matter might rightly be questioned. While the paper is preliminary and not available online, some related insights can be found in Curcuru, Dvorak and Warnock.
Interestingly, even two years after our first conference, economists are still debating why the U.S. current account spread so widely. Marcel Fratzscher, in a paper coauthored with Roland Straub, argues in Asset Prices and Current Account Fluctuations in G7 Economies that equity price shocks were important.
The paper analyses the effect of equity price shocks on current account positions for 16 industrialized countries in 1974-2007. It presents a DSGE model to derive restrictions for the identification of asset price shocks, and uses a Bayesian VAR with sign restrictions to empirically test for the effect of equity price shocks. Such shocks are found to exert a sizeable effect, with a 10% equity price increase for instance in the United States relative
to the rest of the world worsening the US trade balance by 0.9 percentage points after 16 quarters. Moreover, the response of the trade balance to equity price shocks varies substantially across countries, and this heterogeneity appears to be linked in particular
to the financial market depth and equity home bias of countries.
In contrast, Robert Dekle, in a paper coauthored with Suparna Chakraborty, takes a different tack:
An influential explanation for the recent rise in the U.S. current account deficit is the boom in U.S. productivity. Using a two country general equilibrium model, this paper quantitatively shows that the gap in productivity growth between the U.S. and the “rest of the world” cannot explain the U.S. current account deficits, especially in the 1980s and the 2000s. This is because on a GDP-weighted basis, the “rest of the world” actually had higher productivity growth during these periods, and standard macroeconomic models would predict an outflow of funds from the U.S. to the rest of the world, and a consequent U.S. current account surplus. We show that changes in the degree of global financial integration
can help explain this anomaly in U.S. current account behavior. We find, however, that our model overpredicts the growth in U.S. GDP in the 1990s and 2000s.
Giancarlo Corsetti presented preliminary work conducted with Andre Meier and Gernot Mueller, attempting to answer this question:
What are the macroeconomic effects of shocks to government spending? We analyze this
question by specifically exploring non-linearities in the impact of fiscal shocks on output, private
consumption, the trade balance, and real exchange rates in a sample of OECD countries. We
consider non-linearities due to the size of the shock, the degree of openness and size of the country,
and the initial budgetary conditions. After identifying fiscal shocks as residuals of estimated
spending rules, we use them as explanatory variables in single variable regressions, including
interaction terms. In our finding, in normal times the consumption multiplier is positive, yet
quickly decreasing in the size of expansions; at times of fiscal strain it becomes unambiguously
negative. Correspondingly, the trade balance deteriorates substantially in normal times, consistent
with twin deficits; it shrinks, and turns into a small surplus at times of fiscal strain.
Turning to current account balances more generally, Jaewoo Lee presented a paper coauthored with Hamid Faruqee entitled “Global Dispersion of Current Account: Is the Universe Expanding?”. From the introduction:
This paper reexamines the global distribution of current accounts viewed from a longer term
perspective. Using a panel of over one hundred countries that comprise over 95 percent of
world output, the analysis establishes a set of “stylized facts” regarding the individual and
collective behavior of current accounts over the past four decades. In particular, we examine
the dispersion properties of external imbalances and interpret these empirical regularities in
the context of increasing openness in trade and financial flows — often referred to as
“globalization.”
The basic point is illustrated by this graph.
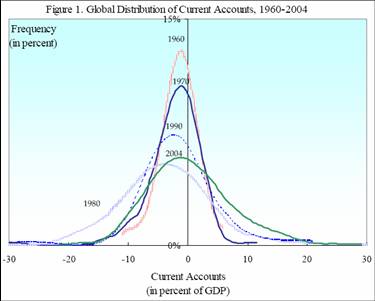
Figure 1 from Faruqee and Lee (2008).
They find the following:
- The universe of current accounts has been expanding over the past half century.
Based on a variety of measures and methodologies, the global constellation of
external current account positions has markedly widened over time. While dispersion
can vary significantly from year to year — ostensibly in response to large international
shocks, there is a steady, underlying rate of expansion of around 2 to 3 percent per
year.
- In other words, in a context where global gross financial flows have grown rapidly,
net flows have also increased (on a sustained basis) to individual countries. And sign
reversals in the current account are occasional, but not frequent. Reflecting this persistence in current account imbalances, countries that have run larger external
imbalances in the past also tend to run subsequent, larger imbalances (of the same
sign), suggesting a extenuation of international lending or borrowing patterns.
However, the underlying, long-run trend toward greater global dispersion suggests
that inertia in current accounts from year to year may be overstated by simple
estimates of persistence.
- Rising dispersion is also found to be closely associated with increasing financial
integration of the world economy, among other things. At the same time, individual
current account series and changes in net foreign assets (as ratios to GDP) are found
to be stationary (albeit persistent), indicating that while dispersion is rising, basic
intertemporal resource constraints are not likely violated for individual countries. -
Global imbalances though have run well ahead of underlying dispersion trends. The
recent acceleration of external positions in major countries (including the United
States) is clearly not fully accounted for by the trend behavior exhibited by the
universal expansion.
Shang-Jin Wei presented a paper entitled “Current Account Adjustment: Some New Theory and Evidence”, coauthored with Jiandong Ju:
This paper aims to provide a theory of current account adjustment that generalizes the textbook version
of the intertemporal approach to current account and places domestic labor market institutions at the
center stage. In general, in response to a shock, an economy adjusts through a combination of a change
in the composition of goods trade (i.e., intra-temporal trade channel) and a change in the current account
(i.e., intertemporal trade channel). The more rigid the labor market, the slower the speed of adjustment
of the current account towards its long-run equilibrium. Three pieces of evidence are provided that
are consistent with the theory.
Turning to the issue of trend increase in services exports, Catherine Mann presented U.S. International Trade in Other Private Services: Do Arm’s Length and Intra-Company Trade Differ?, coauthored with Deniz Civril:
US international trade in so-called ‘other private services’ (OPS) has more than tripled in the last decade to account for 13 percent of total exports and 5 percent of total imports. About 30 percent of this trade is between a US multinational parent and its affiliates abroad (intra-firm trade), about 60 percent is ‘arms-length’ trade. Using annual panel data across countries and time, this paper examines the likelihood that US trading partners in goods also exchange Other Private Services, whether this probability affects the factors that drive OPS trade, and finally investigates whether the factors that drive OPS trade differ according to multinational ownership and the level of income in the source and destination country. We conclude that selection bias – to trade with the US in goods and services or just goods – does not impact the foreign factors that affect trade in services. The positive factors are economic size, richness, internet connectivity, tertiary FDI assets, and bilateral trade agreements and negative factors of distance, taxes, corruption. The foreign factors that differentially enhance intra-firm trade in OPS as compared to arms-length trade include: a higher share of services in GDP, greater internet connectivity, and more tertiary FDI assets. Factors such as relative wage growth abroad, corruption, distance, and language do not differentially affect intra-firm vs. arms-length trade in OPS. Dividing the sample into relatively richer vs. relatively less rich foreign trading partners suggests that internet connectivity is much more importantly associated with intra-firm trade in OPS for the less rich trading partners.
Finally, Charles Engel presented a paper coauthored with John Rogers, entitled “Expected Consumption Growth from Cross-Country Surveys: Implications for Assessing International Capital Markets”. They find that ten year real expected interest rates (as measured by survey data) are not equalized across major economies. And further, consumption growth seems to follow income growth more, and to be less correlated with expected real interest rates, than implied by theory. As they observe, “the empirical findings present a challenge to the building block of many macroeconomic models, in which expected consumption growth is driven by the ex ante real interest rate.”
The conference is part of the three year project on “Current Account Sustainability of Major Industrialized Countries”, funded by the Center for World Affairs and the Global Economy (WAGE). As part of our activities, we also held another conference on May 1st, entitled “Global Imbalances and the U.S. Dollar: Doing Business in the World Economy”. At that conference, Mike Knetter (Dean of the UW Business School), Jeffrey Frankel (Harvard Kennedy School of Government), Michael Melvin (Barclay’s Global Investors), and Catherine Mann (Brandeis and Peterson Institute) debated the global outlook.
Technorati Tags: current account,
dollar,
sustainability, net foreign assets,
productivity.
Very interesting Post, it is something I never really looked at in depth.
Banker
Menzie:
Any papers in this series that examine the effect of loose monetary policy on current account balances since the early 2000s? Clearly, monetary policy wouldn’t explain everything, but many of the countries that have run large current account surpluses have been competitively pegged to the dollar–effectively increasing the cost of their domestic consumption while decreasing the cost of consumption for the U.S.–it stands to reason that the loose monetary policy of the Fed during the early-to-mid 2000s had some part in the story.
In short, it seems some part of the “saving glut” could be attributed to policy choices made by monetary authorities, both in the pegging country (e.g. China) and the anchor country (i.e. U.S.).
The lopsided male-female ratio in China caused by sex-selection abortions is worsening, pushed up to 120 men for every 100 women, a government newspaper report issued Thursday by the Shanghai Express.
That would explain some of the savings glut in Asia.
I like the work that shows differential effects of shocks, a shock being a sudden change in which sectors other than financial bear most of the reorganization.
But the real measure is the dispersion. Dispersion in global accounts is equivalent to productivity growth, offering more choices. But, dispersion should reach a limit. If dispersion is increased accuracy in measuring the value of international good traded, then getting the next bit of accuracy ultimately cost much more than a reorganization would.
David, sounds like a slam dunk.
Easy credit in a consumer-driven GDP with relatively low trade barriers and relatively high production costs.
Why is it _not_ in that list of studies?!
I actually consider the first chart to be positive. Look at much the trade deficit ex-oil has improved.
Almost all of our CA deficit is due to two things – oil and China. Of this :
1) Once China’s currency creeps up to fair-market rates, and their domestic economy becomes large enough, or deficit with them will shrink.
2) It appears that Oil deficit dollars have peaked. Rising costs per barrel are being met with a corresponding fall in consumption. So the dollar imports of oil have hit a ceiling.
It seems that in the next decade, we will eliminate the ex-oil deficit, and the oil deficit may be a bit smaller than it is today. So the total will once again be under 2% of GDP.
If the oil deficit is smaller, and the price of oil is larger, then the US will be consuming considerably less oil. If the US is consuming less oil, what effect will that have on GDP? Will the US GDP be as big with only 80% or 50% of the oil consumption it not enjoys?
I might remind the readers here that for every $100 a barrel, the US trade deficit is $450 billion . So, if within 2 years oil reaches $200 a barrel, then the deficit from oil alone would be $900 billion. MOreover, each year, the US produces less oil, so just to maintain consumption levels, it has to import more oil each year.
Oil has become the single most important factor in the trade deficit any analysis that does not include oil as a primary variable is circumspect in my view.
Under plausible assumptions of income at home and the rest of the world, the current account deficit will resume widening and the negative NIIP/GDP ratio will continue to expand. However, even by the year 2020, the negative NIIP/GDP ratio will be no higher than it is in several industrial economies today, and U.S. net investment income payments will remain very low.
This is the paragraph I have trouble with. I don’t think 2-4% GDP growth is plausible. The era of plenty is over. We are entering an era of scarcity..with no foreseeable end. In physics, this is called a phase transition. In sales, its called going from a buyer’s market to a seller’s market.
Has anybody done an analysis of the US deficit under modest contraction through 2020? According to the EIA, petroleum consumption is down 2.4% this year. How long can GDP grow with oil consumption down by 2.5% year after year?
might remind the readers here that for every $100 a barrel, the US trade deficit is $450 billion . So, if within 2 years oil reaches $200 a barrel, then the deficit from oil alone would be $900 billion.
That is silly, because technology and consumption patterns adjust accordingly.
That the US trade deficit from oil is less now at $123 than when oil was $80 itself proves you wrong.
How long can GDP grow with oil consumption down by 2.5% year after year?
Because technology causes more dollars to be produced per unit of oil. The US produces twice the REAL output per barrel of oil as in 1977.
Come on. Surely you are not that naive…
David: Now that you mention it, I see the models are primarily real. I’m sure the argument you put forward has been discussed in various places, since it’s a natural outcome of a small economy pegging the exchange rate at a level that results in a current account surplus, combined with sterilization. See this post for my take on this view.
KevinM: We’ve heard “slam-dunk” in other contexts, so I’d be wary. While this explanation is obvious, and has some empirical content, it’s not clear that it makes sense for a complete explanation for why the US runs such a large deficit. Many countries have pegged to the dollar for long periods, but run deficits. You need some exogenous trigger, as well as some motivation for why countries want to peg. In other words, you need at least in part a real explanation (e.g., the financial crisis in East Asia). That’s what these approaches try to provide.
GK: A lot of the improvement in the net exports to GDP ratio is driven by the slowdown in US growth. The first paper I mentioned (Kamin et al.) projects resumed deterioration in the net exports to GDP ratio once US growth returns to trend.
In addition, if only the Chinese yuan appreciates, then the US trade deficit is merely re-allocated to other countries.
Finally, the oil price increase far outstrips the decrease in quantity of petroleum product imports. With 12 month futures indicating little decrease in prices, I’m not as sanguine as you.
Menzie,
How can an improvement in net exports be due to an economic slowdown, if the improvement began in early 2005, and the economic downturn only began in late 2007?
The timing seems off.
A Yuan appreciation does not allocate the deficit to other countries. The Indian Rupee has also appreciated a lot, even against the Euro. There is not an unlimited supply of large poor countries left that can produce top-quality goods. There are fewer and fewer cheap remaining places to import from. We might be at or near the peak of this sort of arbitrage.
Also, the oil import deficit seems to not be rising as a percentage of GDP, even as oil jumped from $80 to $100 (at the end of Q407). I see that clearly from your chart. The oil import deficit rose until 2006 (when oil wasw $70), and then barely rose at all, or even plateaued. $70 to $100 cause no additional rise, it appears.
GK, you said “The US produces twice the REAL output per barrel of oil as in 1977.” We supposedly have a $14 trillion dollar GDP upon which the CA deficit is measured.
I’m not an economist (I’m a Six Sigma quality manager) but I have long had great doubts about the accuracy of measuurements we use for outputs that make up the GDP (and about the the GDP itself given many questions about actual inflation used in the calculation.) Presicely what do we describe as real output of our economy? Retail purchases of goods made elsewhere? Overpriced healthcare with value only in US? Building houses for ourselves? The ever popular subprime mortgages and CDOs? I’m sorry , but I think we need other measures of value because using the current output measures and current values of GDP does not give us an honest picture of our economy. That, of course, inhibits the type of conversations that policy makers should be having and simply encourages politicians to continue to make irresponsible and unsustainable “solutions.”
Anonymous, I made a similar post to yours a long time ago. Basically, it boils down to, “Are all GDPs equal?” Or does the structure of GDP count for anything. Does it only matter how many chess pieces you have on the table, or does their rank and position count for anything?
Petroleum Imports / Total Exports would seem to be a better figure. this figure tells how much oil it imports in order to produce a dollar of exports. Or you could invert it to see how much value you are producing per dollar of petroleum imports. the rationale is that you have to pay for oil imports with exports. This measures your ability to pay.
GK: The non-oil deficit started improving in 2005, when expressed as a ratio to GDP. But the total deficit did not start improving until 2007Q1.
Regarding oil, plot nominal and real imports, and you will see what I’m talking about. Quantity variation is overwhelmed by price variation in the past few quarters.
Thank you Anonymous & Vorpal !!!
It is very refreshing to hear some common sense applied to discussions of economic shibboleths.
GDP and CPI have been repeated and repeated and repeated… until like so many other political assertions, they become accepted and acquire “truth” by nature of their reiteration.