Only on a day like today does an over 1 percent decrease in industrial output move to third page. But this item (and this hilarious article h/t Economists View) reminded me to update the indicators used by the NBER BCDC are headed. Their trajectories are, in general, not too comforting.
Consider first the series that prompted the investigation. In Figure 1, I show (in logs) industrial production and manufacturing production; the former is the one considered by the NBER BCDC.
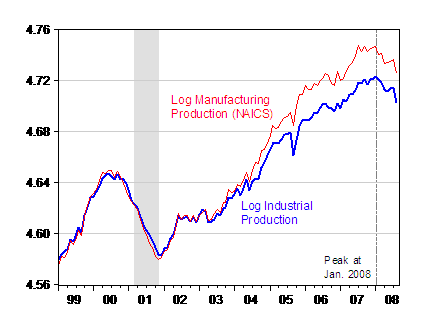
Figure 1: Log industrial production (blue), and log manufacturing production (NAICS definition), 2002=100. Line at industrial production peak; NBER recession dates shaded gray. Source: Federal Reserve Board via St. Louis Fed FRED II, accessed 15 September 2008.
The peak was in January 2008 for industrial production. Interestingly, the peak for manufacturing was earlier, in September 2007. I found this remarkable given the stress that has been made about strong export growth supporting US aggregate demand. I would have thought there would be a much less marked decline in manufacturing output. But apparently this is not the case.
Next consider nonfarm payroll employment. I’ve discussed the various aspects of the August employment situation release already [1], but it’s useful to recap what the peak in this series was: December 2007.
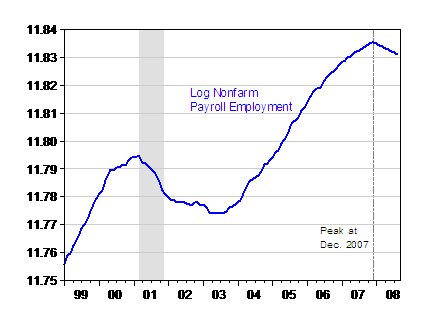
Figure 2: Log nonfarm payroll employment (blue). Dashed line indicates peak; NBER recession dates shaded gray. Source: Federal Reserve Board via St. Louis Fed FRED II, accessed 7 September 2008.
Now consider real personal income less transfers and real manufacturing and trade sales, the last two key series focused on by the NBER BCDC.
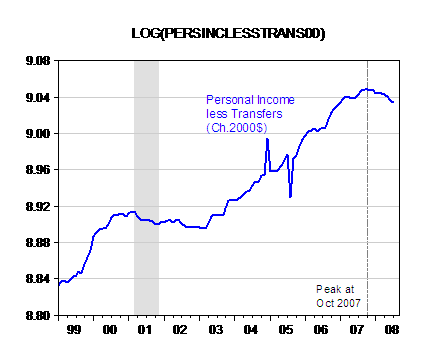
Figure 3: Log personal income less transfers in Ch.2000$ (blue). Real personal income calculated by subtracting off transfers from personal income, and deflating by the personal consumption expenditure deflator. Dashed line at peak; NBER recession dates shaded gray. Source: BEA GDP release of 29 August 2008, and Supplemental Table 2BU, and St. Louis Fed FRED II, accessed 7 September 2008, and author’s calculations.
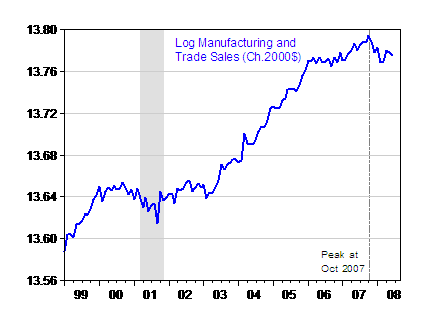
Figure 4: Log manufacturing and trade sales in Ch.2000$ (blue). Dashed line at peak; NBER recession dates shaded gray. Source: BEA GDP release of 29 May, and Supplemental Table 2BU.
Both of the series peaked in October 2007, although it is conceivalble that manufacturing and trade sales have reversed course (the last observation is for June).
Now, not all the news is bad for the times-are-fine thesis. The month-old GDP index compiled by Macroeconomic Advisers indicates that June 2008 GDP was substantially up.
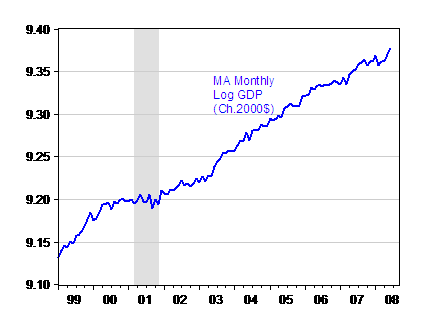
Figure 5: Monthly log GDP (Ch.2000$). NBER defined recession dates shaded gray. Source: Macroeconomic Advisers [xls], August 15, 2008 release.
Of course, June is in 2008Q2, and we’re now puzzling over 2008Q3. We’ll just have to wait for Macroeconomic Advisers’ newest estimate (which should come out any day now). e-forecasting‘s estimate for July and August month-on-month annualized growth averages out to 1.65%. The one point that I would observe is that just as official GDP is revised as the source data is revised, so too is the Macroeconomic Advisers series (and presumably the e-forecasting one as well). From the February Macroeconomic Advisers’ report on the monthly GDP series:
…As currently estimated, Monthly GDP in December 2007 was at an all-time high, suggesting that it’s unlikely that the economy slipped into recession at the end of last year. However, revisions to the underlying source data could overturn this observation.
That’s a cautionary note, given what previous revisions have done to the official GDP series: [2], [3].
I’ll let the reader decide what to make of these trends. For me, they merely confirm what Jim wrote a week and a half ago.
And if you remain skeptical that we are in, or about to enter, a recession, then three things to consider:
- The current financial crisis is in some sense the reflection of the failure of certain institutions to deleverage, or recapitalize, fast enough. This process is going to further reduce the availability of credit, thereby slowing down the economic activity further — a process laid out in this post.
- The decrease in the equity markets today, if persistent, will further constrain consumption, to the extent that wealth is a argument in the aggregate consumption function (4 cents on the dollar is the conventional wisdom regarding the MPC out of financial wealth).
- The losses to equity markets — and jamming up of credit markets — appears to be a trans-Atlantic phenomenon. Hence, the likelihood that rest-of-world economic activity can continue to sustain US aggregate demand seems ever smaller.
See also Brad Delong.
[Update, 9/16 9:12am Pacific]: Macroeconomic Advisers has released its GDP series, up to July. H/t Peter Summers.
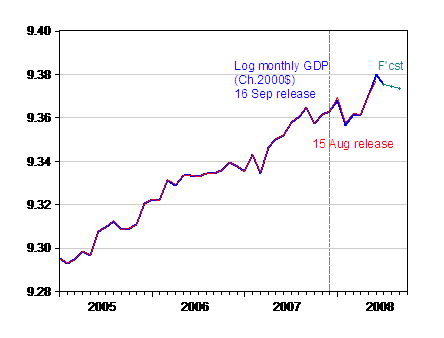
Figure 6: Monthly log GDP (Ch.2000$), release of 16 Sep (blue) and of 15 Aug (red); MA forecast (teal +). NBER defined recession dates shaded gray. Source: Macroeconomic Advisers [xls].
[Update, 9/16 12:55pm Pacific]: e-forecasting’s Maria Simos has kindly provided me the data for e-forecasting’s monthly GDP series, extending up to August. It is plotted with the Macroeconomic Advisers’ series in Figure 7 below. The August figure was revised downward to -0.3%. This means the average growth rate over July and August has been revised down from 1.65% at annual rates to 0.05%.
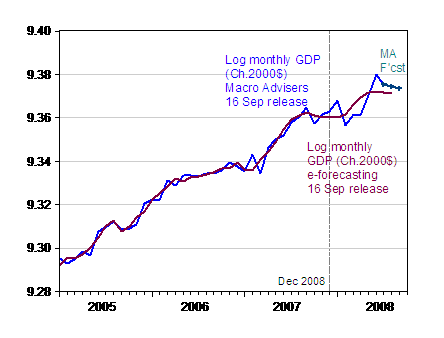
Figure 7: Monthly log GDP (Ch.2000$), Macroeconomic Advisers release of 16 Sep (blue), MA forecast (teal +), and e-forecasting release of 16 Sep (maroon). Source: Macroeconomic Advisers [xls], and e-forecasting release of 16 Sep.
Technorati Tags: recession, industrial production,
manufuacturing production, nonfarm payroll employment,
and
personal income, sales, and GDP.
But the price of oil, dropping from average $128 dpb in August to $95 today, will potentially add nearly 2% to GDP, not including the impact of price falls of other largely imported commodities.
And it will ease the sharp falls in automobile production.
Still interesting times.
But there was a bump in log manufacturing production in 2Q2008 as seen from the graph. So it has helped GDP in 2Q2008. It has since receeded due to the rising dollar.
To bill j: to my knowledge the actual effect of oil on gdp is much less pronounced since the intensity of oil consumption in US is now much lower than during the previous significant oil spikes. This probably relates to other resources too. can anyone elaborate?
What are those two offsetting spikes in personal income less transfers in 04 and 05?
Consider the effect of $140 a bbl oil across all industries. High diesel prices have in some cases forced truckers to mothball their trucks. That has increased the ability of other truckers to increase their prices to manufacturers and retailers, who then have to pass on those costs to consumers. At $95 a bbl, those trucks come out of mothballs and prices come down again.
Also, any oil-based product, or product that needs oil to be consumed for its production (like ethanol, plastic, etc.) will vary in price (or profit to the producer, in competitive sitations), affecting either the consumer or the producer.
Further, this inflation is part of the adjustment that lowers the personal income data, and decreases consumers’ comfort levels.
So, if oil comes down, prices deflate, companies can hire more people, they can pay their mortgages, food and gas, and consumer confidence rises.
Obama’s comment that he wanted oil prices to go up, “just not this fast”, makes me cringe with disbelief.
What is definitely interesting about some of the manufacturing data that so unambiguously signaled a recession in 2000-2001 is that it has largely been at a steady rate of 0% growth + or – a little here and there depending on the month. The ISM survey along with the Chicago PMI and the New York Fed data have not been particularly negative in recent months. These indicators certainly seem to be pointing toward contraction, but not particularly heavily. http://www.nasdaq.com/econoday/reports/US/EN/New_York/napm/year/2008/yearly/09/chart.gif
If manufacturing data is only now beginning to truly roll over and slip definitively into contractionary territory, then the recessionary period employment data has been in since the start of the year will be a good deal longer than people had been hoping. The fact that the overseas economies seem to be only now weakening with slumping growth in Europe, Japan, and now apparently Latin America as well with a series of poor economic indicators out of Brazil, would seem to imply that this economic cycle is closer to its beginning than its end.
Menzie,
MA’s latest monthly GDP numbers show revision to +1% for June (from 0.7%) and a drop of 0.4% for July. They’re expecting 0.1% declines in August & Sept.
PS
Menzie – I enjoyed reading the Luskin piece and Mark Thoma’s response. I can’t wait for the discussion this is going to stimulate! I can say that an important ethos in the “Republican” Reagonite camp is optimism and esprit de corp… Luskin’s article continues this fine tradition in the face of contradictory data. The three bullet points you list are extraordinarily significant, but only hint at the scale of the financial destruction that is taking place: A 40% overall drop in R/E will wipe out about $8 trillion in assets. This does not include credit card, LBO, commercial R/E, and consumer installment debt; as well as unrecoverable debt from derivative and equity market contraction.
Greg B – I suppose everyone is repulsed or frightened by different stimuli… for you its higher oil prices… for me its global warming putting at risk entire ecosystems and a current account deficit impoverishing America.
To the student: the bumps in personal income are due to the Microsoft dividend. The graph is the change in income (from same quarter previous year?), so there’s a big bump up in 2004 when it was paid out, and a big drop down a year later when it wasn’t.
“The one point that I would observe is that just as official GDP is revised as the source data is revised, so too is the Macroeconomic Advisers series (and presumably the e-forecasting one as well).”
Menzie – Just want to clarify for those not familiar with the our series, yes, we at e-forecasting.com also revise our US monthly GDP series and we benchmark it to the official estimates of GDP.
Menzie-
In that hilarious article, what specific facts did he get wrong?
First disclosure: Don Luskin is a friend of mine.
Rich asked a good question. No one, not even Mark Thoma, challenged Don’s numbers with other than an offhand remark. There was no contradictory information.
What we have is Don cherry picking numbers and Mark Thoma cherry picking numbers and others cherry picking numbers. The fact is currently we are not in a recession and no one knows if we will slide into a recession.
My emotions have been on a roller coaster because we seem to move right up to recession then return to growth, then move right back up to recession then back again.
But in the final analysis let’s just stick to facts. We are not in a recession.
Rich Berger: No factual errors, that I can tell. Just misleading statements, sort of like “drilling in ANWR will reduce oil prices” [1], ceteris paribus. True, but without context misleading (which is why I tend to graph things instead of talking about specific observations). For one instance of this in the Luskin article, I’ll refer interested readers to knzn.
DickF: Your statement that “We are not in a recession” seems remarkably definitive. How do you know when the NBER BCDC will set the trough date? I know several of the members, and I wouldn’t be so presumptuous to know what they would decide in a meeting.
You are right to say a recession has not been declared by the BCDC. But that is not the same as saying we’re not in a recession.
By the way, did you notice the first derivatives for the first four series plotted are all negative?
Sorry Menzie. I can only deal with what is. I have no idea what the future will bring. Right as of this moment we are not in a recession as defined right now at this moment. I will yield tomorrow to you.
Back to the issue, Don and I have had some discussion about the economy and he has a much brighter feeling that I do. One area where he and I have had strong disagreement is that he believes that the FED should raise interest rates to fight inflation. I believe that interest rates should be kept right where they are. In most instances it is not the level of interest rates that are critical but the change in interest rates. Businesses will adapt to new economic environments so a stable envirnoment is better. Constant changes cause business dislocation as contracts are written for old rules that no longer apply. I think Don’s optimism has led him in a dangerous direction.
Menzie-
If you actually read DL’s article, he was responding to Obamuh’s web site which said the the personal savings rate was the lowest since the Great Depression. Obamuh did not say the average of the last 4 quarters was the lowest – but I guess I should infer that he was. Consequently, knzn’s comments are interesting but not on point.
Rich Berger: I did not say Mr. Luskin’s article was factually incorrect. I said it was hilarious — exactly because it took data points out of context and put the most (to put it lightly) positive spin on it. I understand how you might not share my sense of humor, though.
On a more substantive note, I would welcome your views as to what the 7 graphs in my post suggest regarding the trajectory of the economy, in the context Mr. Luskin’s comments, and consensus forecasts from, for instance, the WSJ survey.
DickF: I apologize, but I still don’t understand. How specifically do you define and determine the advent of a recession? Is it the time period that will be defined by the NBER BCDC? Or is it a two consecutive quarter decline in GDP? And if it is the latter, are you using the August 2008 vintage of GDP? Or will you wait until the annual benchmark revisions to make your judgment regarding 2008Q2 figures? Or the comprehensive revision that will take place some years in the future? Or is your recession judgment based upon specific qualitative characteristics of the economy? Without further specificity, it is hard to conduct any sort of meaningful debate.
Menzie –
In response to your question, I quote the NBER per the link you gave in your post:
“Because a recession influences the economy broadly and is not confined to one sector, the committee emphasizes economy-wide measures of economic activity. The committee views real GDP as the single best measure of aggregate economic activity. In determining whether a recession has occurred and in identifying the approximate dates of the peak and the trough, the committee therefore places considerable weight on the estimates of real GDP issued by the Bureau of Economic Analysis of the U.S. Department of Commerce. The traditional role of the committee is to maintain a monthly chronology, however, and the BEA’s real GDP estimates are only available quarterly. For this reason, the committee refers to a variety of monthly indicators to determine the months of peaks and troughs.”
My evaluation – the key graph is real GDP which has yet to show a decline (and as noted by DL has recently grown at a 3.3% annual real rate). The other measures you cite may be used to pinpoint a recession when GDP growth turns negative, but are not determinative. Consequently, I do not believe we are headed for a recession although major sectors of the economy are experiencing severe difficulties. My crystal ball warns me that this is my best guess and I may be wrong. You makes your bets and takes your chances.
Donald Luskin, doing for economics what he did for OpenFund and IPO & New Era fund….
I love that Frenkel bit in which he notes that Luskin says that the economy did better under Republicans than Democrats assuming you define Kennedy and Clinton as Republicans and Nixon and Bush I as Democrats.
And if we simply define down as up, everything the Republicans say makes sense.
Rich Berger: In your quote from the BCDC statement, you left out the part in the next paragraph which states:
Hence, Figure 7 is, I think, relevant.
My evaluation – the key graph is real GDP which has yet to show a decline
It’s funny that, as we seem to be going from crisis to crisis, there always seems to be some new factor that keeps the economy from going into a true recession. For example, those export numbers that supported Q2 GDP.
Going forward, if commodities really have had their bubble burst, and prices ease, that certainly could be the catalyst for keeping us out of a true recession.
Having said back in January that the US was in recession, and provided the link to a site that used data to determine that in a repeatable, multi-year fashion, and having seen several large banks disappear since then, I am intrigued that some folks still say “we are not in recession”.
On a related tangent, the Treasury issued a press release today announcing a program to provide funds to the Federal Reserve Bank.
An extract says, “The Treasury Department announced today the initiation of a temporary Supplementary Financing Program at the request of the Federal Reserve. The program will consist of a series of Treasury bills, apart from Treasury’s current borrowing program, which will provide cash for use in the Federal Reserve initiatives.”
Does this mean that the Fed is in, or foresees a situation in which they are illiquid, and needs cash? How should this supplemental financing be interpreted? Why would the Fed request more funds?
Menzie –
I had earlier read the paragraph you cited as a description of the monthly indicators it uses to determine peaks and troughs, as referred to in the paragraph I quoted. Sequence – determine if a recession has taken place using real GDP and then use the secondary indicators to nail down the start and finish dates. No recession, no start date.
Rich Berger: A reasonable line of reasoning — but then see the answers to FAQs 1 and 4 in the same document.
I suppose Rich and Dick will next be telling us what a great thing the free market is and how there is never any need for government intervention or regulation of the markets…..
Donna-
Is there really any question that the free market is a great thing?
Never any need for government intervention of regulation? Would not necessarily agree, but I do believe that government intervention is on balance, a force for ill.
Dick – why don’t you weigh in?
BTW – I see that Joe Biden is calling the payment of extra taxes a patriotic act. Why isn’t he allowing the non-wealthy a chance to pay more taxes? Is he prejudiced against them?
Re, the discussion of NBER recessions, I’ve spent quite a bit of time on their website trying to reverse-engineer some of their methodology, and one of the things I came across was a mention that recessions typically see a drop of -1% or more in employment from the peak.
With non-farm payrolls around 140 million, that would mean a loss of 1.4 million jobs from the peak, and we’re still quite a ways away from that, even now.
FWIW.
Sebastian
Sebastian: Good point. As has often been remarked — so much so that I’ll call it a stylized fact — the last two recessions have been shallow in terms of job loss from peak-to-trough; on the other hand, the period of zero or slow employment growth has been much longer, post-trough.
If, as some commentators have suggested, outsourcing has meant less required labor input into the production process, then one might not see as pronounced declines in labor input in a modern recession. But that is mere conjecture on my part.