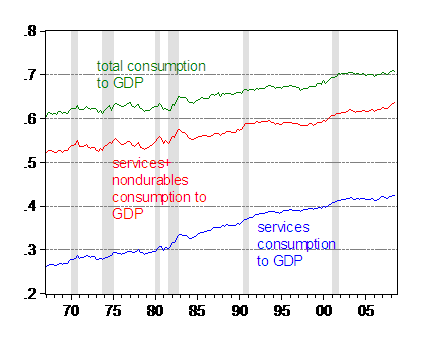
There’s been a lot of talk about how consumption will fall in the future — some of it added by myself [0]. I’m trying to fit some regressions now, to make some guesses about how consumption will move in the future, based on guesses about GDP and net wealth. I haven’t got very far, but at the very least, I can share some interesting pictures. Figure 1 depicts nominal shares of services, services and nondurables, and total (i.e., adding in durables) consumption, over the 1967-2008 period.

Figure 1: Services consumption to GDP ratio (blue), services plus nondurables consumption to GDP ratio (red) and total consumption (services plus nondurables plus durables) to GPD ratio (green). NBER defined recessions shaded gray. Source: BEA NIPA release of 30 October 2008, NBER, and author’s calculations.
What I find of interest is the long term upward trend in services consumption. Of course, this share is expressed in nominal terms, and we know that the relative price of many services has been rising.
The picture also highlights the fact that nominal consumption has risen from about 60% of GDP in 1967 to about 70% in 2008. (It also reminds me that “stylized facts” change — when I was in graduate school, the ratio was about 65%; I’ll let readers guess when that was…)
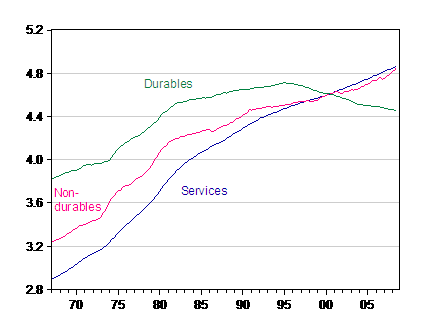
In figure 2 I plot log prices of services, nondurables and durables. Notice that durables prices have been declining since the mid-1990’s, and have started to stabilize.

Figure 2: log price deflator for services consumption (dark blue), nondurables consumption (pink) and durables consumption (dark green). Source: BEA NIPA release of 30 October 2008 and author’s calculations.
Perhaps more importantly, what is implied by this picture is that the relative price of durables has been declining quite rapidly over the past ten years (either vis a vis nondurables or services), and so looking at nominal expenditures can be misleading.
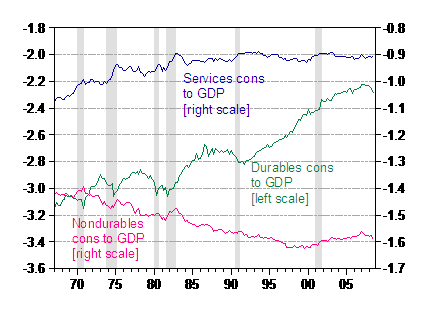
Unfortunately, it is hard to interpret the ratios of real consumption to real output expressed in Chained dollars (the ratio of two chained output series does not have a ready interpetation) [1]. Hence, I plot log values (note two vertical axes, with durables measured on the left hand side).

Figure 3: log real durables consumption to GDP ratio (dark green, left axis), log real services consumption to GDP ratio (dark blue) and log real nondurables consumption to GPD ratio (pink), all in Ch.2000$. NBER defined recessions shaded gray. Source: BEA NIPA release of 30 October 2008, NBER, and author’s calculations.
For the moment, I’ll observe that the trend behavior of durables consumption appears different from that of nondurables and services. We know from textbooks that’s true at the cyclical frequency (consumer durables are procyclical like investment), but here, we’ve seen a differentiation pertaining to longer term trends. Hence, in any consideration of the future medium term path of consumption, one will have to take into consideration differential behavior of consumption components.
In other words, when answering the question of what components of consumption will adjust the most, one will have to take a stand on the evolution of relative prices, as well as the more conventional determinants of consumption behavior, such as the intertemporal rate of substitution, and wealth effects.
[Update 8:40pm Pacific]

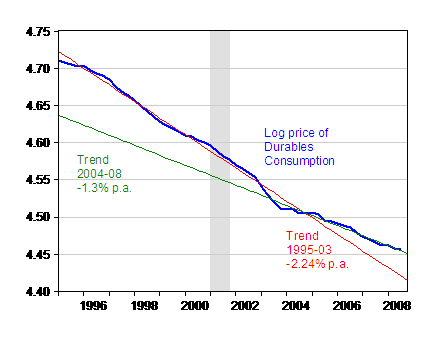
Figure 4: Log price deflator for durables consumption (blue), 1995-03 trend (red) and 2004-08Q3 trend (green). NBER defined recession shaded gray. Source: BEA NIPA release of 30 October 2008, NBER, and author’s calculations. (Labels for trends fixed 11/12 2:40pm Pacific.)
Technorati Tags: recession, consumption,
durables, and services.
May I suggest two additional concepts that should shed light on your project – total cash flow through households, and “economic stress”. Households consume; they also save. Both have to be in the equations. With persistent economic uncertainty on the horizon, I would expect savings to increase, and total consumption to decline. You may not get the later result just from looking at consumption. “Economic stress” is some measure of problems in the economy – maybe it is the unemployment rate, or the bank failure rate. When its high, durables consumption declines, as one can see in the charts. My general point is you need some “drivers” that affect marginal consumption decisions when major changes occur in the economy. FWIW.
I continue to be intrigued by the concept of services as a part of the GDP. I am speaking of services such as retail, financial planning (not to be confused with those fine financial products we exported, health care, lawn care or even home building – 70% of the econonmy?! Many of these are things that are currently a large part of our GDP calculations but have virtually no value in the international marketplace – and with some impact on trade balance I would think. It occurs to me that not only might our GDP calculations be somewhat questionable but also the ability (or value) of measuring change in services consumption. Effectively, arent a lot services just an expression of the value we place on our time to master and perform those services our selves? And if we are truly in deflationary times (almost inarguable) then might we not begin to allot less value to our time? And if thats true then clearly service consumption would go down but it would have lower value in GDP calculations. Ouch my head hurts!
Ok, you are sooooo old Menzie, but this can only mean “tested”…possibly then, “qualified” …even “presidential”. But necessarily “testable”.
This B it.
Where exactly in Fig 2 is that (Durables)line showing any sign of:
Notice that durables prices have been declining since the mid-1990’s, and have started to stabilize.
Ok, maybe I can get out my ruler and see some gradual lessening of the downward slope…the peak at ’95 is of more interest and it would be nice to see how this correlates to the demographic profile and how seniors bite in on those services and not so much on those lettuce sandwiches.
And of course it wouldn’t be a genuine Menzie post without a log graph (now here is where my eyes make a stunning recovery and I wish to report a nose dive in Durables cons to GDP from ~2007).
This helps: In other words, when answering the question of what components of consumption will adjust the most, one will have to take a stand on the evolution of relative prices, as well as the more conventional determinants of consumption behavior, such as the intertemporal rate of substitution, and wealth effects.
But I am surprised that your approach is to dissect the consumption (thank you, and I can take more) rather than examine the productive side…which could be in the works, provided there are enough of us to bang something together.
Very nice graphs. In the last years, I think the positive trend in prices of both non durable products and services have been influenced mainly of the strong demand, and we’ll see some change in the future because part of this demand was leveraged by the bubbles. The price of durable goods has been gone down because it has been showed the benefits of the technological progress and most imported products from China. How the change in relative prices will impact in the future consumption is a difficult question.
Footwedge: Just because a service (or any other good) is not traded internationally does not mean it’s worthless.
calmo: I’ve added Figure 4; since the prices are logged, then a change in the slope can be read as a deceleration in percentage rate of change. I’ve included the trend percentage rates of decline for subperiods; the 04-08 annualized rate is -1.3% vs. -2.24% for 1995-2003 (in log terms).
Mike Laird: Thanks for the insights. I think they’re related to the buffer stock model of consumption.
Menzie: you are right, of course, regarding the value of services. My very poorly put point was that it seems to me that a GDP calculated without the context of what it means in our globalized world seems . . . oddly simplistic. What is the REAL value of a GDP of $14 trillion if it is – and of course it isn’t totally – comprised of us simply swapping things around within the good old USA (healthcare, government, etc.) while importing everything we actually use? As a noneconomist it just seems to me that there is this clinging to old beliefs and methodologies in the face of evidence that those beliefs do not match reality. I think that there is something to Occam’s Razor when examining anything and this might be another example of that. Or not. Thanks for all the thoughtful info.
Professor, some months ago, I took a crack at a similar question, and used simple, top-down metrics.
Question — how long will the downturn last?
Last depression — debt problems were with mortgages and margin loans
Boom: ’22-’29, mortgages, consumer credit, and margin loans (‘MCM debt’)/GDP: 54% –> 69%
Bust: ’29-’33; MCM debt fell 8% per year and GDP fell 12% per year –> ratio of MCM debt/GDP grows to 124%
Recovery: ’33-’39; MCM debt remained flat and GDP grew 10% per year –> it takes until ’39 for MCM debt/GDP to fall to normal level of 51%
This depression — debt problems are with mortgages and consumer credit
Boom: ’80-’07, MCM debt/GDP: 48% –> 104%
Bust: ’08-’12, assume that, again, MCM debt falls by 8% per year and that, again, GDP falls by 12% per year –> ratio of MCM debt/GDP grows to ~125%
Recovery: ’13-’22; assume that, again, MCM debt remains flat and that GDP grows by 10% –> it takes until 2022 for MCM debt/GDP to fall to normal level of 48%
15 years in total: five years of downward movement and ten years of recovery until we reach normal levels of MCM debt/GDP
Just my sense of how things are going to play out.
Two things that I think I understand to be relevant, but about which I wish to ask.
Isn’t an increase in spending on services characteristic of continued economic development? It is driven partly by the reduction of food as a share of consumption. It is driven partly by the fact that, once there is a TV in every room, you have sort of reached a limit, but you don’t even need to be present to consume services, so you can really consume a lot.
The other thing I want to check is influence of human interaction in the price of services. The instance I am familiar with is entertainment. There is a model (don’t remember whose) of entertainment costs which shows that the actor, signer, guitarist, place kicker or whatever becomes an increasing part of the cost of entertainment as the cost of other elements falls. At some point, the human part of the cost equation necessarily becomes very large, at which point no amount of efficiency gain in other inputs can have much influence. It seems to me the same model fits a good many services. As long as humans provide the service, there is going to be a limit to the cost efficiencies that can be achieved. In manufacturing, automation continues to reduce the human input, so the cost of a human is not such a big deal. Isn’t that a large part of the difference between goods and services price trends?
jg: Seems like an approach that is useful. Since I don’t have a historical bent, I’d like to think about statistically identifiable relationships, and use those to identify likely outcomes. Some of these are the “great ratios” which pertain to consumption-income, investment-income, etc.
kharris: A secular increase in the services share of production is definitely one aspect of economic development. One would suspect that that would be manifested in consumption. Of course, what I have plotted is services purchased by consumers, not by business and government. So there is no mechanical reason why the two should co-trend.
Regarding cost trends, you are absolutely right that others have observed the fact that services prices rise faster than goods prices; as early as the 1960’s, Baumol and Bowen remarked upon this trend. What I find remarkable is the trend break in durables consumption prices at 1995 — not that services consumption prices continued to rise.
That will be nice, to have a higher wattage bulb (than me) examining some of those ratios, how they evolved over time, and what the implications are for today/tomorrow.
Very much related, I’ve looked at fuel efficiency and gas price trends again. Fuel efficiency continues to be negatively correlated with price.
It looks to me that the positive correlation of MPG and Price is almost entirely due to congestion and price both being seasonal (looking at 4 month smoothed MPG and price, there is lots of movement togeth, with a period of 1 year). Use 12 month smoothed data to adjust for seasonality, then you see the real relationship.
Don’t know my CAFE history, but it’s starting to look like a good idea to me. It look that price reduces consumption almost entirely by destroying productivity. However, CAFE improves fuel efficiency, effectively increasing supply and lowering prices. This means economic stimulus, as lower prices, like roads, induce demand.
Hey Menzie,
I know you must be really busy thinking about the crisis effects in the developed world, but, please, answer me: what about the emerging economies which are losing with commodities prices declines (i have liquid commodities exporters like Brazil in mind)? Should their central banks raise interest rates to lower domestic demand (since there is less foreign currency to import)?
Thanks a lot.
I mean, less foreign currency to pay for imports.
“As a noneconomist it just seems to me that there is this clinging to old beliefs and methodologies in the face of evidence that those beliefs do not match reality. I think that there is something to Occam’s Razor when examining anything and this might be another example of that.”
I think you hit the nail on the head with your third word: you are a “noneconomist.” I’m not sure you’re going to get the reply you’re looking for in this thread because you have an astoundingly poor understanding of the broad issue of services value and GDP. I think you may also be suffering from the conventional but incomplete understanding of Occam’s Razor.
I am not even able to find the object of your attack MM,(possibly deleted) but nonetheless feel obliged to defend this phantom.
There is likely no one here with our host’s level of understanding and yet he tolerates us…tis this example YOU need to bear in mind when the urge strikes to pound someone’s “poor understanding”.
Just a gentle reminder that we all started somewhere sometime and learned the ropes, yes?
Menzie, thanks for that reply and I have a question re:
Regarding cost trends, you [kh] are absolutely right that others have observed the fact that services prices rise faster than goods prices;
would this include the price of Alaska Black Cod and waitressing? Is the context restricted to developed economies? to certain services within those developed economies? (the “material movers” as the BLS refers to residential framing labor for instance strikes me as a counter example)
Menzie,
A significant fraction of the population (and in particular, the fraction with the highest incomes and ability to consume) has been planning for retirement on the basis of assumptions such as one finds in a typical retirement calculator, i.e., 10% return on investment prior to retirement, 3.1% inflation, and 8% return on investment post-retirement.
Many of these people have been assuming also that they will downsize out of the large home they currently own, bought with the largest mortgage they could swing, extracting hundreds of thousands of dollars in profit from their expected 15-20% annual price rise (on which they of course believed they would subsequently earn that 8% in the retirement calculator form). And not a few of these people believed that their return on investments in stocks would be not a mere 8%, but rather would be the returns seen in what many of them consider a “normal” market (e.g., the ’82-’00 market, or the ’03-’07 bull markets), meaning 12% or more with dividends reinvested.
These people’s clocks are now much cleaner than they were last year, and are going to end up cleaned to semiconductor fab standards going forward.
And since to bail out all the institutions that need to be bailed out is going to require that interest rates stay at depression levels while the unrepayable debt is inflated away, those people are going to gradually come to the realization that the after-inflation returns they’re going to get on their shrunken net-worths will be much nearer 0% (and perhaps negative) rather than the 5-7% they assumed.
As this prospect sinks in, the savings rate is going to overshoot the levels that used to be normal (8-10%), and that is going to intensify the depression, making recovery even more difficult.
One side effect of this will be that China will come apart at the seams and descend once again into the kind of chaotic state in which it has existed for most of the last several hundred years. A direct outcome of that will be an upward spike in the prices of all those goods we are now getting so cheaply thanks to the Brobdignagian vendor financing fraud Chinese government has been perpetrating through exchange rate manipulation.
We have come to the end of an era. Extrapolating the trends of that era forward won’t yield useful predictions.
Two remarks:
1) Those consumption/GDP ratios that you’re modeling have important implications for the US external imbalance. I’d be interested to know whether you think those imbalances are sustainable. If you don’t think that they are, do you think consumption @70% of GDP is? If we think that the government sector will move further into deficit in the coming quarters, do we think that this means lower NX or higher (S-I)?
2) At the risk of repeating myself yet again, extrapolated recent trends are very, very imprecise.
I’d like to add an odd (or a different) note on Services during economic downturns. What is the history of Services during past down times? I think a comparison of historically similar events and trends might make the above charts something even more meaningful for insight – due to comparison.
I remember reading that Services (in particular)
might go down in price. However, Services as a sector usually remain strong in price relative to GDP. This might be old thinking from Great Depression models – being that Services, I think, took on a larger role in the workforce for various reasons during that time and WWII.
Someone mentioned this in relation to “food” above … but, I tend to think that when people need to make money for food – then the Service industries become the fairly open means whereby someone might make money to buy food.
Anyway, any comparisons from earlier depressions, down times, etc.? I think it would be interesting.
Calmo, thanks for your defense of my apparently ignorant thoughts on services and GDP. However, given the very modest record of most economists – including perhaps even some here? – in having any clue on what is actually going on in the economy over the past several years I am not greatly embarrassed by being acknowledged as a noneconomist. I shall, however, go back and study my Philosophy 101 regarding Friar Ockham’s principles.
Thanks for helping me find you Footwedge…not only my eyes are going, but my patience it appears.
Yours is a broad attack…like MM’s (ironically) and kicks the entire class (all economists –in MM’s case, all non-economists) rather than letting the air out of an inflated and bogus claim…it’s one of those ad hominems…that for some of us exhibit nothing more than the insecurity (frustration? inferiority complex? impatience?) of the attacker (objector? defender? the Puzzled?).
If economics was a simple straight forward matter (like physics), there would be less dissension among its ranks. But it is a social science…sometimes about daily and often politically-charged affairs…what could be more interesting today (calmo imagines the physicists reading the business section of the newspaper somewhat crowding out their scientific journals/papers.)
Very scholarly of you to re-examine the Friar’s original, but I (no scholar, but eva so keen student of anything philosophical) think you understand Occam’s Razor well enough to apply it here (but possibly recognizing it’s limitations when it comes to sub-atomic physics, quantum theory, etc?)…embarrassing those students of economics who don’t like to see anyone trifling with their hard Work and Progress they have contributed to in their favorite science.
I, proud non-economist but keen student, appreciate your smelling something fishy here with what some might call, foundational worries…but not me, I leave that to those way more articulate.
Sorta.
SvN: Yes, there are definitely implications for the current account coming from the idea of a retrenchment. See this post for some discussion. I must say that I was unable to fit an import demand equation for the US that incorporated consumption in the expected manner, however.
Adolpho: Well, this goes back to the debates over the proper exchange rate policy during the East Asian crisis. Higher interest rates will certainly mitigate balance of payments problems in the short term, but might worsen them over the longer term if higher rates push economies into recession, throwing the financial accelerator mechanism in reverse. The best course depends on the situation with respect to reserves stockpiles and the fragility of the financial system in the respective countries.
amos,
When you think of service consumption relative to GDP, you’ve got inventories, capital spending and stuff like that mixed in. Inventories and capital spending swing very hard through the course of a business cycle.
If you just look at consumer spending, there is a soft of hierarchy. Durables spending falls most, non-durables next, and service spending falls least, if at all. Durable endure and so buying new ones can be put off. Hair cuts can be put off for a while, but not as long as a new toaster. Cable TV and internet and the like are consumed or not – pull them or pay. Electricity and water can be used more or less, but most of us don’t stop altogether. So service consumption tends to be steadier than goods consumption.
Same with non-durables vs durables. You run out of soap, so you get more soap. You don’t run out of toaster, so you are more likely to get a new toaster when you fell flush.
Should there not a be a postive feedback loop resulting from the increase in the savings rate that is necessarily cuased by the decline in consumption? All else equal, the increased savings rate will increase the supply of investable capital, reducing the cost of capital, increasing investment/productivity, increasing GNP, will it not? Why do we have long-run concerns about declining investment — it seems ironic given that over-consumption of housing and other goods seems to have been a key cause of the current crisis. Thanks.
Roger Klein: In an open economy, ex post investment need not equal net national saving. Even in a closed economy, ex ante investment demand need not equal saving.