Apropos the post on evaluating the impact of the stimulus, here is graphical depiction of what IHS Global Insight, Macroeconomic Advisers, and Moody’s predicted under the counterfactual of no stimulus against the w/stimulus outlook (from NYT).
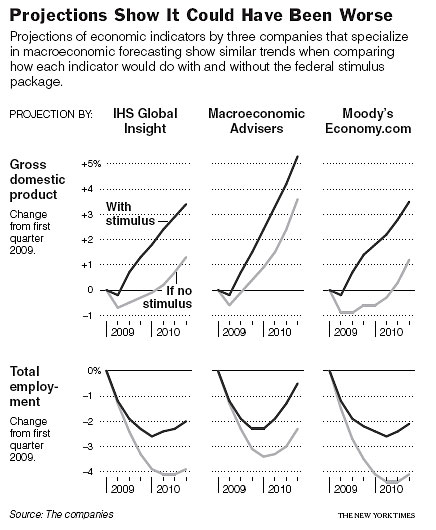
Source: J. Calmes and M. Cooper, “New Consensus Sees Stimulus Package as Worthy Step,” NYT (Nov. 21, 2009).
Menzie,
What I’d really like to know whether or not, and to what extent, the stimulus spending worsens our long-term fiscal outlook, net of the short-term incremental GDP it generates and related revenue feedback. In other words, how does it affect the debt-to-GDP ratio projected for 10 years out, 20 years out, etc. Do you know of any answers?
Well, we know that it will probably take a full generation to get unemployment back under 5%, so the full positive fiscal effects of having mitigated job losses now will not be felt for another 20 years…
So, there’s little doubt the stimulus spending helped our long-term fiscal situation, the question is how much?
Both Brooks and Veblen are concerned about the debt situation. One seems pessimistic, the other optimistic.
Here’s an answer. It’s not the only one but I think I’m fairly neutral.
$787 billion was spent on the stimulus. I’ll exclude $71 billion of that because it was for an AMT patch that the administration did not ask for and nearly everyone concedes has little fiscal stimulus but was imposed by Senate centrists for political reasons. That leaves $716 billion in real stimulus or about 5% of a years GDP.
The average fiscal multiplier of the remaining stimulus (based on it’s content) in our current circumstances (being that we’re in a liquidity trap) based on administrative estimates is about 1.3. That means that the stimulus will probably add about $930 billion to output, or about 6.5% of a year’s worth of GDP spread over roughly 3+ years.
The effective average federal tax revenue raised by the additional output will be perhaps one third of the output so about $310 billion. This means that the net amount added to the federal debt will be about $716 billion less $310 billion or $406 billion, or about 2.8% of annual GDP.
Now, the average real interest on federal government debt is roughly 3.5%. Thus this additional debt will cost about $14.2 billion per year in real interest, or about 0.1% of GDP.
This is my best educated guess as to cost and benefit. You judge if it was worth it.
This reminds me of the story famous in classical economics about the physician who proposed a new surgery, but I will give it a slight twist. The surgeon performed the surgery before a gallery of his peers. The patient died. The doctor then wrote a book about the fact that his patient would have died 15 min. earlier had he not operated.
Yes, things are bad but our projections using our theory say things would have been a lot worse if we had not bled the patient.
MA Sadowski: I think the question Brooks and Veblen are asking is whether the post stimulus growth rate will be the same as it would have been without the stimulus but starting from a higher level than without stimulus, or there will be a lower growth rate because the stimulus brought spending forward. The knock on “cash for clunkers” was that many people believe that the program did not generate additional sales but pulled sales forward.
Since you have given this some thought, I would like to know your projection of 5, 10, 20 year GDP levels as compared to assumed levels without stimulus to see if the stimulus is more than paid for at some point or levels return to projected. Basically, what happens year 4, continued growth or hangover?
Th,
Here’s my best educated opinion of the medium to long run effect of the stimulus on growth. And it depends on whether you believe this is a conventional recession or something worse.
The net increase in government debt will most likely reduce output slightly in the long run. To the extent that people hold their wealth as government bonds rather than in a form that can be used to finance private investment, the increased debt would tend to reduce the stock of
productive capital. The debt would crowd out private investment. Crowding out is unlikely to occur in the short run under current conditions, because most firms have lowered investment in response to reduced demand, which stimulus has offset in part.
In their estimates the CBO assumed that each dollar of additional debt crowds out about a third of a dollar’s worth of private domestic capital with the remainder of the rise in debt offset by increases in private saving and inflows of foreign capital.
The crowding out effect is offset somewhat by other factors. Funding for infrastructure might add to the economys potential output in much the same way that private capital investment does. Other provisions, such as funding for education, could raise long term productivity by increasing human capital. And some provisions would create incentives for increased private investment. Altogether such provisions accounted for roughly a quarter of the stimulus.
Including the effects of both crowding out of private investment, which would reduce output in the long run, and productive government investment which would increase output in the long run, the CBO estimated that by 2019 the stimulus would reduce GDP by 0.1 percent to 0.3 percent on net.
That’s the bad news, but it’s conditional on this being a conventional recession. The good news, or the really bad news, is that this is probably not a conventional recession. This recession is associated with a banking crisis.
The IMF did a study of the effect of banking crises on medium term output (seven years from the start of the crisis by their definition). It’s contained in chapter four of their April 2009 “World Economic Outlook.” In particular they examined medium term output performance following 88 banking crises that occurred over the past four decades across a wide range of economies, as well as the behavior of world output following major financial crises going back to the 19th century.
The IMF found that the path of output tends to be depressed substantially and persistently following banking crises, with no rebound on average to the precrisis trend over the medium term. Growth did, however, eventually return to its precrisis rate for most economies. That’s the really bad news.
Among other things, they also found that a stronger short term fiscal policy response (a larger increase in government spending) was significantly associated with smaller medium term output losses. In particular the results implied that raising government spending by 1 percent of GDP was associated with a reduction in the medium term output loss of about 1.5 percentage
points.
What do I think this means in our case? Well at it’s peak the stimulus will represent about 2.8% of annual GDP. Approximately two thirds of this represents increased government spending (the rest being tax cuts of course). Thus the stimulus will increase government spending by about 1.9% of GDP. Using the IMF estimate this implies that the medium term output loss will be about 2.8% less than in its absence.
That’s the good news, at least in terms of the medium term effect of the stimulus. But it depends on whether or not you believe the IMF results are relevant.
MA Sadowski: Thanks. The IMF research seems to indicate the advance from stimulus in GDP is not off-set by a post-stimulus hangover. I take this to mean the extra debt is quickly paid down by the increased level of GDP (that would not be there without the stimulus)and then contributes to deficit reduction there after (constant tax rate X higher GDP = higher revenues).
Th,
That’s my judgement as well. The IMF research implies that banking crisis seems to make for a super-liquidity crisis, that it dramatically amplifies the benefits of a discretionary fiscal stimulus.
The bottom line is that it was kind of a Pascal Gambit. In our situation, it was better to bet on a worse case than on a better case when forming public policy. We would have lost far more if we assumed a better case.
On the other hand, in retrospect, based on how things are going, the stimulus probably should have been larger. But it’s too late now to go back and do it over again.
In the final analysis, only time and good econometrics will tell.
Mark,
IMF sounds believable, except that I did read a report from one of their other research divisions. They stated that with Japan’s debt to GDP ratio of 220% and climbing, that they believe, taking into account Japan’s demographics, that Japan is about at the point of no return on handling their debt service.
So Japan did hold the record for Banking Crisis, but I think we may have stole the crown. Japan has also been known for monetary and fiscal stimulus, without such a happy result.
I have heard this explained away by people claiming Japan waited too long to cut interest rates and provide fiscal stimulus. (ie Japanese industry went bankrupt and vanished, which is why we don’t see them around any more, and maybe Japan hasn’t recovered yet because they are waiting for foreign investment to come forward and drag them out of a banana republic economy????). So it’s just that when the most famous historical example didn’t get cured by the most accepted textbook econ recipe for success, that plants some seeds of doubt in my mind.
But I agree the $750B wasn’t a huge amount of money, and I don’t see why it wouldn’t add 2% to GDP for a couple years. What you see is what you get, if you got any of it.
It must not be forgotten that this is no ordinary recession. There is still a risk of this either turning into a full-blown depression or a prolonged slump such as Japan experienced in its “lost decade”. Although interest rates are now close to zero, and they have embarked on quantitative easing, no one must take it for granted that recovery is assured. In recent book on Japan’s “Great Recession”, Richard Koo argues that monetary stimulus (including quantitative easing) was relatively ineffective, and that it took significant fiscal expansion to prevent an even larger fall in output.
Cedric Regula,
I’m not sure that Japan is at the point of no return yet or not (they have an amazingly good deal on their debt interest), but I think we have quite a ways to go before we join them. The OMB and CBO projections all seem to put the federal debt at about 65-70% of GDP by 2011. Thereafter it stabilizes at least through 2019. The interest payments on the federal debt as a percent of GDP are forecast to be no worse than they were at its previous peak in the early 1990s.
In my opinion Japan did far too little far too late and whatever they did they tended to unwind it far too quickly. First, they waited for deflation to settle in (by 1994 in GDP deflator terms) before they anything sufficient in terms of monetary or fiscal policy, by which time things were much more problematic. Second, even their largest discretionary fiscal stimulus (1996) was not very large when properly accounted (about 1.5% of GDP) and they totally undid that the following year with a massive increase in their consumption tax (from 3% to 5%). When they first went into ZIRP (February 1999) they only stayed there for little more than a year (until August 2000). About the only thing they seemed to get right was the massive but long overdue quantitative easing in the early to mid 2000s. And I won’t even go into their delayed and half hearted policies addressing their asset bubbles and financial crisis that first erupted in the early 1990s.
Looking at this in terms of public debt burden it seems the worst thing you can do in a liquidity trap/financial crisis is to do too little. Stagdeflation boosts the debt as a percent of GDP and all attempts at fiscal austerity completely backfire. Perversely, seemingly spending irresponsibly leads to a much better outcome in terms of the debt burden. The important thing is to get nominal GDP growing by hook or by crook.
Mark,
Yes, well what can you do about deflation of asset bubbles when you where telling people the Japanese Imperial Gardens are valued at more than the state of California, you invented the 100 year residential mortgage so that people can afford buy a little house for 3 generations of family to live together in, Nikki 40,000 stock is banking system reserves, and interest rates already were artificially low by any world standard at the time. Not to mention the technical difficulties in construction of a meaningful inflation index with this going on, and also a large part of the economy making chips and consumer electronics.
So what’s a government to do?
True they went off of ZIRP all the way up to a half percent. They did $300B of QE and $700B of private capital left the country and headed for treasuries because those had yield.
I hear they did fill all their potholes, and more.
Don’t know where you got the US public debt being stable thru 2019. They are forecasting roughly $1 trillion a year deficit thru then, and that is after putting a GDP growth estimate in.
Our interest payments are good right now because the treasury is getting an unbelievable deal on rates. Tbills are a tax write off at the moment! But the duration of the public debt is only 50 months right now, and great deals can come and go.
Cedric Regula,
In my opinion backing off ZIRP even half a percent is a really questionable idea in a liquidity trap.
As for the US debt estimates they come straight from CBO:
http://www.cbo.gov/ftpdocs/105xx/doc10521/08-25-BudgetUpdate.pdf
The CBO projects that interest payements on the federal debt will rise from about 1.2% of GDP this year to 1.6% in 2011 and to to about 3.4% in 2019. It was 3.3% of GDP in 1991. The difference was that the federal debt as a percent of GDP was 45.3% of GDP in 1991 and is projected by the CBO to rise from 53.8% of GDP this year to 65.5% in 2011 and 67.8% in 2019.
Note that the debt hardly increases as a percent of GDP between 2011 and 2019. The key is that it’s not necessary to run a surplus to reduce the debt as a percent of GDP. In fact usually as long as deficits are less than about 3% of GDP public debt as a percent of GDP will decline. The CBO’s projections show the deficit falling to 3.7% by 2011 and staying in the range of 3.1%-3.4% in 2012-2019.
Note also that this means the average interest paid on the debt was 7.3% in 1991 but it is only 2.2% this year and will rise to 2.4% in 2011 and to 5.0% in 2019. The GDP price index was 3.5% in 1991. It is projected by the CBO to fall from 1.6% this year to 0.3% in 2011 and then rise to 1.6% by 2019. This means the real interest on the debt was 3.8% in 1991. This also means that real interest on the debt is projected to rise from 0.6% this year to 2.1% in 2011 and 3.4% in 2019.
Thus the projections of the CBO already take into account the fact that the real interest rate on the debt will return to normal (about 3.5%). Moreover thanks to the low inflation rates expected in the years ahead it will be possible to hold much more debt as a percent of GDP at about the same net interest payment as a percent of GDP as in 1991.
OMB has projections that are slightly more pessimistic but they more or less tell the same story:
http://www.whitehouse.gov/omb/assets/fy2010_msr/10msr.pdf
So, in my opinion, the public debt sky is not falling (at least through 2019).
Mark,
Ok, when you said “stable”, I thought you meant somehow the debt ceiling grinds to a halt at $12 trillion and Congress won’t need to vote it up again shortly.
But I am aware of the magic rule that says running deficits at 3% of GDP is “sustainable”, meaning forever, unless of course we get what some economists call “the one hundred year event” which is some unforeseen thing sometimes referred to as a Black Swan or something like that.
So I guess we can take comfort in knowing that by 2019 the CBO sees no problem in financing $20 trillion at a rate of 3.5%(Real) + 1.5% (Inflation).
Won’t know till we get there, I guess.
Were these models constructed before or after the stimulus package went into effect?
It looks like these three models all imply spending multipliers of about 1 or less. Making up a few numbers, let’s say:
Total Stimulus spending = $600B over 2 yrs, or $300B/yr, or 2% of annual GDP per year.
The Moody’s and IHS models look like they’re saying GDP is about 2% higher per year (or a touch higher) with than without. So they’re assuming a multiplier of about 1 or maybe a little higher.
The Macro Advisers model looks like GDP is about 1.5% higher with than without. A multiplier of around 0.75 (1.5/2).
If they’d used Barro’s multiplier of 0.8 on government purchases and near-zero on tax cuts, they’d be saying the stimulus helped a bit less than the MA model says. Ramey’s government purchases multiplier is about the same as Barro’s, maybe a touch higher.
So, of course, whether you think the stimulus boosted the economy much depends on your estimates of tax, transfer, and purchase multipliers. Barro and Ramey are surely economists at the top of their field, so their parameter estimates should get at least some weight when considering how much extra GDP a stimulus bill can create.
Finally, recall that GDP measures assume that all government wages and contracts are worth full value, dollar for dollar (aside from price index problems), while that’s not true for private-sector GDP measures, where wasted workers reduce profits dollar for dollar: So in Biden’s race to spend money as fast as possible, our government-sector measures of GDP are likely to be a bit worse than usual. So the estimated multipliers could be nominally right but still wrong in real terms.
Seems like the first best outcome would still have been a Paleo-Krugman/Sumnerian commitment by the Fed to 3% inflation over the next five years. The lower NGDP path makes it harder to repay old debts.