Most economists are projecting a slow recovery in terms of employment. What do historical correlations imply?
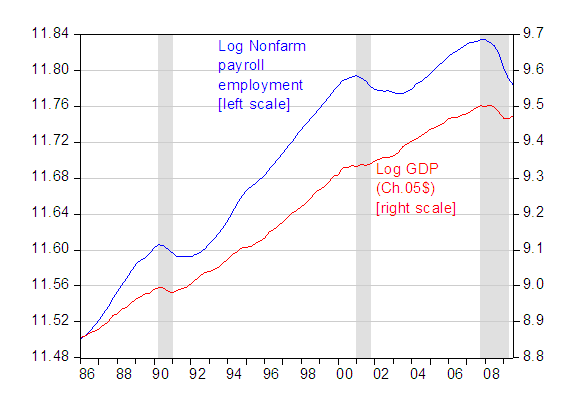
In order to investigate this question, I examine the relationship between GDP and nonfarm payroll employment over the 1986-2009 period, which encompasses the “Great Moderation”. Figure 1 illustrates the log GDP and log nonfarm payroll employment series.

Figure 1: Log nonfarm payroll employment (blue, left scale) and log real GDP (red, right scale). NBER defined recession dates shaded gray, assumes last recession ends at 2009Q2. Source: BEA 2009Q3 advance release, and BLS via FREDII.
I estimate the following error correction specification, which includes 4 lags of first differences, using OLS:
Δ nfpt = 0.54 – 0.069 nfpt-1 + 0.026 y t-1 + 0.60 Δ nfpt-1 + 0.173 Δ y t-1 + … + 0.00046 time – 0.0000017 time 2
Adj. R2 = 0.85 SER = 0.0018, n = 95, DW = 2.02. Breusch-Godfrey LM test, 2 lags, F = 1.84 (p-val = 0.16). HAC robust standard errors. (Nonsignificant coefficients suppressed.)
The long run elasticity of employment with respect to GDP is 0.37, while the short run elasticity is 0.17.
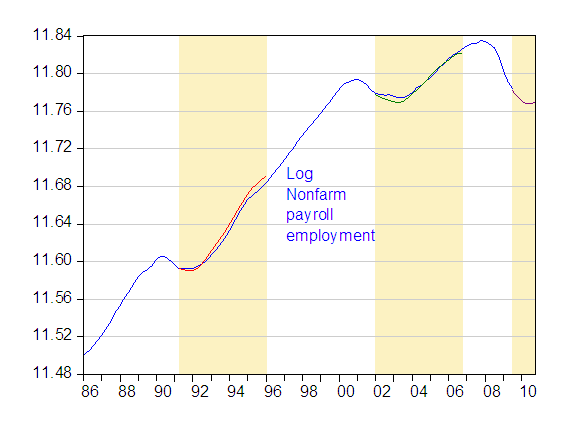
I conduct dynamic simulations (using the regression estimated over the entire sample) for the five years after each recession: 1991Q2-1996Q1, 2002Q1-2006Q4. I also conduct a dynamic forecast for 2009Q3-2010Q4, using the WSJ October mean forecast for GDP growth over that period (discussed in this post) as the right hand side variable.
The results are shown in Figure 2:

Figure 2: Log nonfarm payroll employment (blue) and dynamic simulations from error correction model (red, green, purple). Shaded regions denote forecasting periods. Source: BLS via FREDII, and author’s calculations.
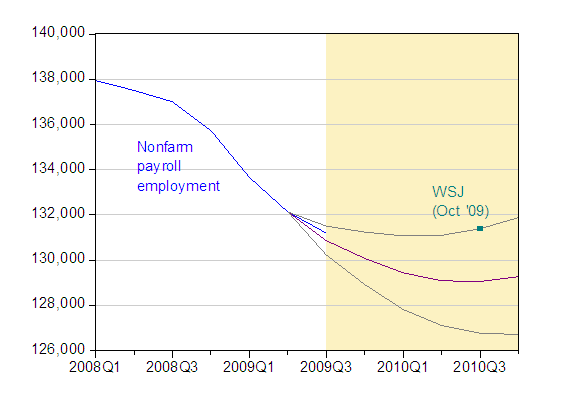
The dynamic simulations initially underpredict nonfarm payroll employment, before overshooting (in the 1990’s) and essentially being on target (in the 2000’s). What does the model imply for the trajectory of employment going forward? The dynamic simulation for the 2009Q3 through 2010Q4 period is shown in Figure 3 (with employment expressed in levels, instead of logs).

Figure 3: Nonfarm payroll employment, SA, in thousands (blue) and dynamic forecast from error correction model (purple), and plus/minus two standard errors (gray lines). WSJ forecast for October 2010 (teal square). Shaded regions denote forecasting periods. Source: BLS via FREDII, WSJ October survey, and author’s calculations.
(Note: for sticklers out there — e.g., juan in comments to this post — what I am conducting here for the 2009Q3-10Q4 period is a conditional forecast, since I am taking the GDP path forecasted by the WSJ survey as given).
I calculate the WSJ forecast for employment by adding the October mean prediction of seventeen thousand per month net job creation to the 2009Q3 figure (literally, this forecast is for October 2010, and should be 17,000 × 12 added to the October employment figure).
Hence, if historical correlations persist, then nonfarm payroll employment will continue to decline through 2010Q2. However, given the imprecision of the estimates, nonfarm payroll employment could begin rising as early as 2010Q2 (the upper gray line).
Of course, not only is there sampling uncertainty; there’s also uncertainty regarding the true model. I’ve imposed cointegration in the estimation procedure (and according to the Johansen maximum likelihood procedure, one can reject the null hypothesis of no cointegration at the 20% level, allowing for deterministic trends in the data). But one could drop that assumption, and assume a relationship in first differences. I estimate:
Δ nfp t = -0.001 + + 0.687 Δ nfp t-1 + 0.210 Δ y t + 0.113 Δ y t-1
Adj. R2 = 0.89 SER = 0.0015, n = 95, DW = 2.05.
Breusch-Godfrey LM test, 2 lags, F = 0.18 (p-val = 0.83). HAC robust standard errors.
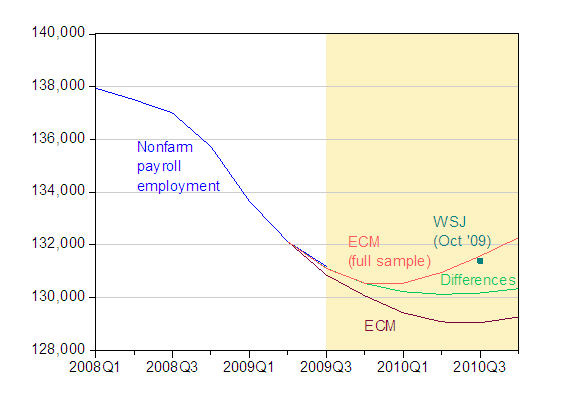
The adjusted R2 statistic is slightly higher in this ARMAX specification, but of course R2 shouldn’t be the key determinant of whether one specification is to be preferred over another. In fact, one might wish to impose the long run cointegrating relationship especially if longer horizon prediction is of central import. Hence, I compare the two (conditional) forecasts in Figure 4.

Figure 4: Nonfarm payroll employment, SA, in thousands, (blue), dynamic forecast from error correction model (purple), dynamic forecast from first differences specification (light green), and from error correction model estimated over 1967Q1-09Q3 period (salmon). WSJ forecast for October 2010 (teal square). Shaded regions denote forecasting periods. Source: BLS via FREDII, WSJ October survey, and author’s calculations.
In this case, job losses taper off, and net job creation occurs in 2009Q3 2010Q3. Or, it could be that the error correction model is correct (cointegration between GDP and employment holds), but the recovery will be more akin to that of the 1970’s and early 1980’s, because of the depth of the downturn. That specification (which would not fit well for the past two recoveries) yields the salmon colored line in Figure 4, and predicts strong job creation in 2009Q2 2010Q2.
James Hamilton says recent output indicators (as of 10/18) are not consistent with a jobless recovery. Paul Ashworth says manufacturing employment has may have [correction added 11/4, 8:45am] already “stabilized”, while Robert Gordon predicts a resumption of employment growth in 2010Q1. David Altig at Macroblog and Mary Daly, Bart Hobijn, Joyce Kwok at SF Fed enumerate the reasons for a slow start in employment growth.
In the current downturn there has been a lot of anecdotal evidence that the categories of state and local govt. and universities were responsible for a lot of lagged job elimination due to deferred recognition of their respective budget crises. It would be interesting to try to put numbers to that idea, as its not hard to see that if their numbers are large enough their behavior would be a lot different than prior downturns.
that reads a little like a complicated way of saying “anything’s possible” to me.
If you start by accepting the WSJ economic GDP growth forecast as “given,” all the rest is likely to be wrong.
Just look at the WSJ’s forecasts over the entirety of this recession: It consistently (& inaccurately) forecast recovery just around the corner. The reason: Almost all the forecasters polled by the WSJ work for firms with an interest in seeing the market recover.
There must be a forecast with a better track record than the WSJ over this recession or longer. Maybe even among the WSJ forecasters there is one or a small subset that have been closer to reality than the consensus.
If I’m reading the charts right, there is not any good news here. Looks like a tough road to Q1 2011 and beyond?
I wonder how it would look if you plugged Jan Hatzius’ GDP forecast into the equation? He sees 2% growth in the first two quarters of 2010 and 1.5% in the last two.
Dave Altig makes an interesting observation.
As Melinda Pitts pointed out a few weeks back, businesses with fewer than 50 employees account for about one third of net employment gains in expansions. They have accounted for about 45 percent of job losses since the beginning of this recession. Given that these are the types of businesses most likely to be dependent on bank lendingand given that bank lending does not appear poised for a rapid return to being robustthe prognosis for an employment recovery in these businesses is a question mark.
If we assume that the Obama administration’s estimates of jobs saved or created by the administration is accurate each job “saved or created” cost around three times the average wage of a worker. If we then consider that the small businessman is more sensitive to reductions in his profit and that they normally employ at the lower income levels, it is not difficult to understand that if they are going to have to support creating a job for a worker at three times the wage of their own employees, the saving or creation of one Obama job will create three unemployed.
As long as we have government jobs projects that cause a net loss of three jobs for every one created I don’t care how many graphs you draw or equations you solve, unemployment is going to continue to increase.
Excellent work Menzie. I think the average of the two estimates is consistent with what the consensus is expecting.
@ Terry: There are other forecasts you could use, such as the Blue Chip or the Survey of Professional Forecasters from one of the regional fed banks. But I doubt it would make much difference as all consensus forecasts tend to be more or less the same, and share many of the same participants.
I think it is clear after Q3 GDP that the current recovery will not be V shaped. Given the observation that credit markets experienced a depth of problems heretofore unseen, it is not likely that historical relationships apply. I would view the most pessimistic case in your model as the most optimistic case going forward.
In addition to credit market issues, we have an administration determined to reduce the efficiency with which the economy creates jobs by adding burdesnsome regulation and taxes to small and large business alike.
To put the ‘jobs saved’ number in perspective say 1 million for the sake of arguement, the economy destroyed more than 1 million jobs in the last 2 months as evidenced by initial claims for unemployment above .5 million per month.
What if doing the same analysis using non farm payroll as % of active population and GDP as % of population?
For the record, Ashworth doesn’t say employment generally has stabilized; rather, he says yesterday’s manufacturing ISM suggests *factory* employment has stabilized. Today’s ADP report contradicts that, and today’s ISM services report — where most of the jobs are anyway — showed a de-stabilized labor market, if anything.
Simon: Good point: The exact quote is ‘Paul Ashworth of Capital Economics said: “At that level, the index suggests that factory sector payroll employment may have stabilised.” ‘ Will fix.
Thanks for sharing that model. It would be great if you could post a spreadsheet so we could examine it. I tried to get the data myself and run the model, but I got similar but different results.
Also, how did you calculate the elasticities?
Thanks!
Anom: It’s an error correction model, so you divide the coefficient on the lagged level of the GDP variable by the coefficient on the lagged employment. I’ve posted the data here.
The consumer is on a very slow long term track and the savings rate will approach 10%. This is a blue collar recession (typical old style) for manufacturing and construction but it is also a consumer led service recession. Typically construction and manufacturing lead us out of recession. This time construction will still be losing jobs in 2011 due to too many offices, warehouses, factories and apartments. Manufacturing may well be a limited engine (11% of the economy-much smaller piece) because of the weaker $. The other main difference is the 50 & over crowd that has been shocked into cutting spending. In most recessions most of this crowd hardly slows down. This group will not resume spending but will continue to increase savings. The low interest rates are actually a very negative factor for this group as they contemplate the amount of funds needed for retirement (the Japanese propblem). This is going to be a slow “jobless” recovery. It will take 7 to 10 years to get all the lost jobs back.