The TFRG range of oil spill flow reported yesterday was the lower bound. From PBS Newshour, regarding the 12,000-19,000 barrel per day estimate:
…at least two experts on the panel say that those numbers actually represent what they consider the lower boundary range of the possible amount of oil.
Wereley and Leifer were both members of that team, and Leifer participated in the satellite image analysis as well. Both researchers say that the seven minutes of video that BP provided to the plume team was not sufficient to estimate the upper boundary of the amount of oil — only to give a lower-end estimate.
“What everyone on the panel agreed was that due to the low-quality data BP provided to us, it would be irresponsible and unscientific to estimate an upper bound to the emission,” said Leifer. “So what we presented in the [plume team] report is a range of expert opinions on what the lower bound is.”
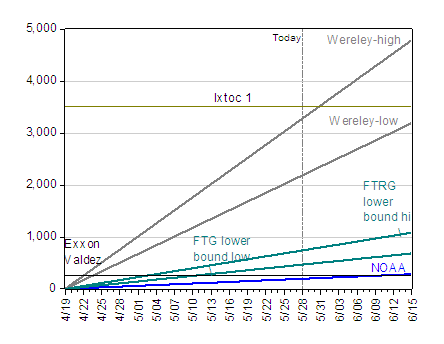
Here is a revised version of the graph depicting the implied cumulative spill, given this information.

Figure 1: Estimated cumulative oil spill, according to NOAA original estaimte (blue line), according to Wereley plus/minus 20% bands (gray lines), and Flow Rate Technical Group estimates of low end of lower band and high end of lower band (teal lines), Exxon Valdez spill (black line), and Ixtoc-1 spill (black line), all in thousands of barrels. Dashed vertical line at May 28, 2010. Wereley estimate is from Steven Wereley/Purdue University. Source: NPR; Reuters and PBS.
The record for a well in the US Gulf is 40,000 bpd.
Just had a conversation with a ‘crazy’ deep-sea and oil specialist who claims there was never any real chance of anything working except relief wells, and that those are months away. His take was that the efforts to date were nothing more than measures to assuage the masses, who would be screaming that SOMETHING be done right away.
Depressing.
The real import about the wide deviation in the various estimates of cumulative oil spilled is that BP will eventually be fined for the total volume discharged. This total can be obscured with the use of dispersants, causing the oil to be emulsified in the water column.
It’s interesting to note that the initial Coast Guard/BP/NOAA satellite estimate was 5K-bbl/d; the May 27th USGS estimate was 12-19 K-bbl/d; but the May 15th independent Wereley estimate was 70 +/- 14 K-bbl/d. My perspective, is that a reasonable estimate could be made if sounding samples through the entire water column were collected over a grid in the effected area. From that, a relatively accurate estimate of the discharge could be made. That this data collection effort has not been undertaken on a systematic large scale, indicates that obfuscation and deception are the rules of the day.
I would also predict that the “Top Kill” pumping of heavy sediment will continue at the BP/TransOcean well until relief wells have significantly reduced the well pressure. The great benefit of the drilling mud, is that it obscures how much oil is spilling from the well on video.
I see Congress is finally starting to act on a measure to get rid of the $75 million dmages cap. I wonder if it will cover all damages from the BP leak, or if the cap will still apply to damages already caused.
Republicans making very stupid arguments against the measure (such as that small refiners may be hurt).