The Bureau of Economic Analysis, which last month had estimated that U.S. real GDP had grown at a 2.4% annual rate during the second quarter, today revised that estimate down to a 1.6% annual rate. But the revision isn’t quite as discouraging as it might sound.
 |
For one thing, much of the revision down in GDP growth came from a downward revision in the estimated extent of inventory restocking during the quarter. Thus, whereas last month’s numbers implied that real final sales grew at a 1.3% annual rate during the second quarter, today’s estimate is that real final sales grew at a 1.0% annual rate– not a very radical revision as far as the fundamentals are concerned.
The other important revision was that the growth in imports, which had already been an implausibly large drag on second quarter growth, is now estimated to have been an even bigger drag than at first claimed. Whatever the explanation for that is, our Federal Reserve Chairman does not expect it to be repeated:
Like others, we were surprised by the sharp deterioration in the U.S. trade balance in the second quarter. However, that deterioration seems to have reflected a number of temporary and special factors. Generally, the arithmetic contribution of net exports to growth in the gross domestic product tends to be much closer to zero, and that is likely to be the case in coming quarters.
| Quarter | GDP | GDI |
|---|---|---|
| 2009:Q1 | -5.0 | -5.0 |
| 2009:Q2 | -0.7 | -1.6 |
| 2009:Q3 | 1.6 | 0.0 |
| 2009:Q4 | 4.9 | 6.5 |
| 2010:Q1 | 3.7 | 4.1 |
| 2010:Q2 | 1.6 | 2.3 |
Whatever you make of that, another detail that I found mildly encouraging is that the August BEA release provides us with the first estimate of gross domestic income for Q2. According to economic theory, gross domestic income should be exactly the same number as gross domestic product. In practice, since they are constructed in part from different sources, they are not exactly the same number, and the government faithfully reports their difference as an entry in the national income and product accounts known as “statistical discrepancy.” By definition, we don’t have a good theory of where the statistical discrepancy comes from or how to interpret it. But Federal Reserve economist Jeremy Nalewaik has argued that GDI is sometimes a better measure than GDP for tracking the business cycle. Because the “statistical discrepancy” entry has been shrinking over the last year, the rate of growth of GDI has been coming in a little better than GDP lately. GDI shows a 2.3% annual growth rate for the second quarter, or about the same rate as BEA had reported with their first estimate of GDP.
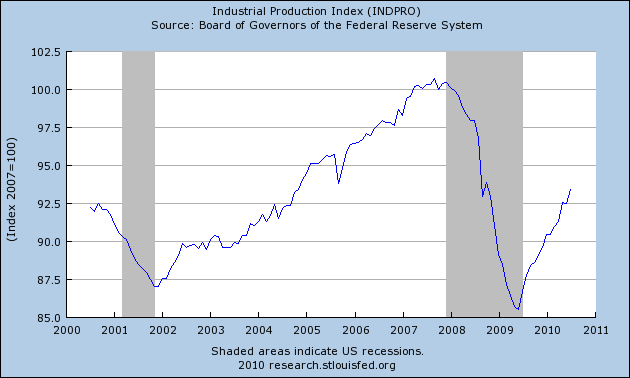
As long as I’m passing along the not-as-awful-as-we-thought spin on the economic news, I should also mention that the Fed’s index of industrial production grew by 1% in July. That’s 12% at an annual rate, if we were lucky enough to see it repeated for a whole year– no danger of that, unfortunately. But the favorable industrial production numbers were likely a key factor that helped pull both the Chicago Fed National Activity Index and the Aruoba-Diebold-Scotti Business Conditions Index back up to zero, away from the alarmingly negative numbers with which both had flirted last month.
|
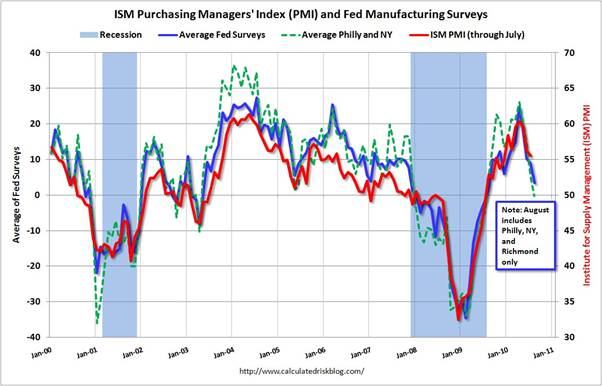
But will the growth in manufacturing continue? Computer sales, which had been one of the healthy economic sectors, appear to be softening, with Intel reporting today that it is now expecting third-quarter revenue of $11 B, down from an earlier anticipated range of 11.2-12. And Bill McBride notes that the weak manufacturing reports coming in at the regional Federal Reserve Banks likely portend a deterioration in national manufacturing indicators such as the PMI.
|
Here’s how Fed Chairman Ben Bernanke summarized his outlook in Jackson Hole this morning:
Overall, the incoming data suggest that the recovery of output and employment in the United States has slowed in recent months, to a pace somewhat weaker than most FOMC participants projected earlier this year…. I expect the economy to continue to expand in the second half of this year, albeit at a relatively modest pace.
It seems that may be about the best that anybody hopes for at this point.
How’s that Recovery Summer working out for you?
Roubini just upped his “chances of double dipper” to 40%. Schiller just upped his to 100%.
NBER has not called the end yet, so maybe they will just wait a couple more years.
Larry Kudlow retired to he wouldn’t have to announce the lawn died. Green Shoots didn’t take.
Big stock market rally today, of course.
The buck only dropped a quarter percent on Bernankespan’s speech, but it has been dropping from it’s highs since late June, so they sniffed out QE2 a while ago. Plus Euroland kicked their can of worms down the road a ways, so the euro got a reprieve.
Big change in mood with the t-note market. It sold off significantly. They used to like the Fed buying, and get almost giddy about recessions, but something different was on their mind today.
Right on track, nothing overly surprising so far.
It’s still the bestest depression we’ve ever had.
Someone please go over to Krugman’s site and try and cheer him up. He’s playing Al Jolson tunes and scaring everybody. Or maybe they really did close down all the soup kitchens in Princton, NJ.
JDH: nice summary, thanks for posting.
Stock market follows the pattern which happened after 9/11 2001 stock market panic, but in different ( approx 3 times longer ) time scale. Mode of reaction to sharp drops in equity values does not change-and that is transmitted into “real” economy.
So stock will move up rather steeply till November 2010 reaching DOW 11750 (and so will expectations about economy) , fluctuate a bit till (with a 20% dip in February to 10 000) with another smaller peak (11 000 ) in July 2011 and than take a huge dip ( down to 6000) in H2 2011.
This will then be the next recession. It will last at least during 2012, exactly before 2012 elections. Just what Obama needs to get ousted. Guess who will win the presidency? Someone not Democrat and tough enough to pass as decisive.
Following change of power in White house in the beginning of 2013, its obvious that next war will start around end of 2013-2014, most likely Iran and Central Asia in general. Started by someone, may be not even the USA. Israel? Not a small one, considering nations and populations ( China, Russia, India, Pakistan, Iran, Israel, USA, Afganistan, Oil countries in Middle Asia, Siberia) involved. And not a short one, at least 3 years long active phase up till 2017-2018. Commander in chief will remain the same. Hope people won’t get nuclear. But they may- too much of that stuff around, too high stakes in the next war.
Than, of course, as always in wars, in 2014 stocks will start to move up after initial scare as people will be forced to give up savings as short term thinking will prevail.
This time Europe will be relative safe haven in this war… if that will be possible.
Wow, Ivars.
With that kind of forecasting precision, you should be trading large, short-dated, way-out-of-the-money options. You’d be a billionaire in no time.
I’m certainly not as big a fan of Bernanke as you are. And I’m not a genius or thoroughly trained in economics.
But two things I would say that I think even a thoroughly trained economist should perk his ears up on or agree. Years of observation, pain and my current Gin and Dr. Pepper binge taught me this. GDP is not good at gauging the pain men feel on the street. But it is similar to what somebody said on the capitalistic system—-It is still, nonetheless the best overall gauge we have come up with to this time on the general overall economy. PERIOD
Professor Hamliton,
The July industrial production gain of 1% was to a large extent due to the fact that far fewer auto plants than normal closed for summer retooling so the seasonal adjustment over-compensated. That will be a drag in August. The Fed noted that in their release, but most news accounts ignored it.
What were the special factors Bernanke’s was referring to in regards to the trade deficit? That’s the first I’ve heard of this explanation.
People like Michael Pettis have been predicting we would take a hit on our trade balance. The explanation is pretty straightforward: many deficit countries have to cut back spending severely (Spain, Portugal, Greece, Ireland, Hungary, the Baltics, etc.) and meanwhile the “virtuous” savers/exporters, (China, Germany, East Asia, etc.) are trying to maintain growth by growing exports even further.
Because of our open capital markets and expansionary policies, we’re likely to be the ones taking up the slack.
So far, Pettis has called this spot on.
http://mpettis.com/
JDH I’m not seeing this reduction in the statistical discrepancies. At least not when I look at the year-to-year measures. If anything the big difference is that in the first half of the decade National Income was typically greater than Net National Product, whereas in the latter half of the decade the tendency has been for Net National Product to be greater than National Income. Maybe that’s because I am looking at year-to-year rather than quarter-to-quarter or quarter-over-quarter.
This is purely anectdotal bad news, but my colleagues over in the industrial base assessment side of DoD say they are getting lots of “heads-ups” and alerts from military suppliers preparing for bankruptcy actions later in the year. Could just be self-serving posturing, but maybe not.
With the workforce growing at an average 2.5%, I don’t see how we can call a 1.6% GDP growth rate “recovery.”
More people will be unemployed, the unemployment rate will go higher, and the incomes of most of us will continue to erode.
With a recovery like that, who needs recession/depression?
Bernake did not say why he thinks the large increase in imports is an abberation because he has no justification for his position.
If computer sales decline in the U.S. that will reduce the trade deficit in computers (which accounted for 12 % of the year on year change in the last trade deficit figures). But the reduction will be a share of the 12%, not the whole amount.
Before you put too much hope on computer output pulling the rest of the economy along you might note that an inventory problems appears to be emerging in the computer sector as the computer I/S ratio has moved above its 12 month moving average.
Chairman of the Joint Chiefs says national debt is #1 security threat.
I’d expect Obama to hypovehiculate Admiral Mullen any day now.
This might be one of the closest things to a real-time measure of trade:
This is from the Association of American Railroads latest weekly rail traffic release:
“AAR Reports Weekly Rail Intermodal Volume Sets New 2010 Record- up 22.4 percent from the same week in 2009, and up 2.6 percent compared with 2008.”
Intermodal traffic is mainly containers and most imports arrive in containers. So intermodal traffic is up 2.6% from 2008, while all other traffic is still down 11% from 2008.
http://www.aar.org/newsandevents/freightrailtraffic/2010-08-26-railtraffic.aspx
If you look at the charts at Railfax, you can see how intermodal traffic tracked the steep fall in imports in 2009, and high they are now rising more steeply than in the summers of 2005-8.
http://railfax.transmatch.com/
Bernanke’s explanation that the jump in the trade deficit can be attributed to a number of “temporary and special factors” would seem to be yet another instance of him missing important movements in data because he explained them away.
Remember, this is the guy who never saw the housing bubble and told us about a dozen times that the lending problems were contained to the subprime space.
He might be the right guy to have at the monetary levers when the proverbial crap hits the fan, but you’re likely to get more accurate analysis of the current economic situation from the guy sitting on the next stool drinking his beer.
I figured this shit out in July of 1979. Monetary lags have exhibited the same exact length for the last 97 years. You don’t have to compute these dead-end concepts (GDI & GDP) to know where the general economy is going.
They obviously tell you absolutely nothing. Why? Because if they were telling you anything you would be setting off the alarms.
W.C. Varones I’d expect as much. ADM Mullen is a Navy guy. But he’s wrong, just like he’s wrong about a lot of things.
Ivars
If you’re right about Margaret Thatcher winning the White House and starting WWW3, I think you need to lower your DOW forecast to DOW 600. Maybe DOW 60.
Cedric,
There is a chance. Or it could be all wrong. The first test is Dow going up to 11750 during next month or two.
Regarding positive signs, it is encouraging that domestic private final demand actually accelerated in Q2. Some evidence, at least, that the handoff from stimulus to real economy is happening. Graph here.
And a technical point on GDI. Menzie recently commented on the work of Berge and Jorda concerning recession indicators. Menzie covered the short piece published by FRBSF. The full paper is well worth a read. Of relevance here, they show that in using GDP or GDI as a recession indicator, on the basis of short-term changes, GDI comes in ahead, with area under the ROC curve at 0.92, compared to 0.89 for GDP.
Jim Fickett,
Stimulus spending actually peaked toward the end of Q2, plus you had the hiring of 500,000 temporary census workers.
If such a handoff occurs, it won’t really be apparent until the data in Q3 & Q4 is out.
W.C.Varones
When worlds biggest information market undergoes steep panic shocks like one after Lehmans,its reaction pattern may be similar to previous shocks, e.g. 9/11 or 1987.
Initially,system freezes and its response is as if it has become linear > exponential growth. What happens after that,is what happens now,and will happen in future .
There is no way the consequences of so deep information shock will be gone sooner than 10 years. Aftershocks of the Great Depression lasted 16-20 years.
Even 9/11 (relatively shallow but as sharp panic) took financially 3 years and a war to be smoothed.
War promotes spending as uncertainty about future increases-that is why stocks go up during wars.
I’ll take the under just now. I saw Princeton area housing and rental values absolutely collapse in late June to early August–mirroring the national statistics.
I feel this shock is likely too much for the economy in its current fragile state.
Back to recession for me.
ivars, 87 wasn’t a shock. the FED did it. you could see it coming for miles, & miles, & miles.
this is a lousy metric (a surrogate– because the FED discontinued the G.6 release). but it’s better than anything the FED uses. it is inconsistent & non-conforming, but, we still definitely, & unquestionately, know the future:
2010 jan ,,,,,,, 0.54 ,,,,,,, 0.22 top
2010 feb ,,,,,,, 0.5 ,,,,,,, 0.09
2010 mar ,,,,,,, 0.56 ,,,,,,, 0.07
2010 apr ,,,,,,, 0.55 ,,,,,,, 0.13 top
2010 may ,,,,,,, 0.48 ,,,,,,, 0.05 bottom
2010 jun ,,,,,,, 0.47 ,,,,,,, 0.04
2010 jul ,,,,,,, 0.5 ,,,,,,, 0.07
2010 aug ,,,,,,, 0.48 ,,,,,,, 0.07 Top
2010 sep ,,,,,,, 0.5 ,,,,,,, 0.03
2010 oct ,,,,,,, 0.37 ,,,,,,, 0.02
2010 nov ,,,,,,, 0.29 ,,,,,,, -0.02
2010 dec ,,,,,,, 0.22 ,,,,,,, 0.02
2011 jan ,,,,,,, 0.03 ,,,,,,, 0.01 bottom
2011 feb ,,,,,,, 0.11 ,,,,,,, -0.03
2011 mar ,,,,,,, 0.19 ,,,,,,, -0.02
2011 apr ,,,,,,, 0.11 ,,,,,,, 0.01
As the #’s indicate, the proxy for inflation falls (-47) in four months. This is skewed to the downside (exaggerates), but the change is huge. The economy will crash, stocks will crash, bonds will top out, and another selling & buying opportunity of a life time will present itself.
It’s true that the July numbers you cite and some others were stronger than expected, overall pointing to a continuing slowdown but a very gradual one. My sense though is that August was worse relative to July than July was to June.
What Ben said about net exports was not positive. He did not give any indication that he expected the very negative recent deterioration to correct. All he said was that there were (unnamed) special reasons for the rapid deterioration and that net exports rarely improve or deteriorate so quickly.
The GDI argument is rather empty and pointless.
Tom: The relevance of the GDI number is that it suggests to me that the latest GDP reading is a slight underestimate.
It does make sense that real GDP and its growth rates would lie somewhere between two estimates produced by differing methods. But the GDP method estimates have better data, at least compared to contemporaneous GDI method estimates.
Contrary to economic theory and Nobel Laureate Milton Friedman, monetary lags are not “long & variable”. The lags for monetary flows (MVt), i.e., the proxies for (1) real-growth, and for (2) inflation indices, are historically (for the last 97 years), always, fixed in length. However the lag for nominal gdp varies widely.
Its a scientific fact that economic forecasts are mathematically infallible. Nominal (gDp) will cascade in the 4th qtr (down in every month – Oct, Nov, & Dec), without fiscal/monetary intervention/stimulus. We will never reach “escape velocity” (despite countervailing stimulus).
Since Professor A. W. Phillips of the London School of Economics constructed a curve that indicated high rates of inflation were associate with low rates of unemployment and vice versa, there has been much talk in and out of academic circles about the trade-off between inflation and unemployment.
Most economists are now sophisticated enough to realize that if such a trade-off does exist, it is a very short run phenomenon. Data on the U.S. economy reveal no such inverse relationship between rates of inflation and rates of unemployment as the Phillips curve suggests.
If there is an inflation-unemployment trade-off curve, it is shifting to the right, and at an accelerated rate.
Clearly, the notion that unemployment can be permanently reduced to a tolerable level of ?? to ?? per cent simply by pumping up aggregate demand is both nave and dangerous. But a majority of the Federal Open Market Committee (FOMC) has evidently acted on the assumption that monetary policy could play a major role in solving the problem of chronic unemployment.
This is made evident in the published policy Record of the FOMC, and by a comparison of the periods in which a restrictive monetary policy was followed in the periods of easy money policy (the FED’s mandate notwithstanding).
But it isnt within the power or responsibility of the Federal Reserve to hold unemployment to a 5 or even a 6 per cent. In fact, to assume that the Federal Reserve can solve our unemployment problem is to assume the problem is so simple that its solution requires only that the manager of the Open Market Account buy a sufficient quantity of U.s obligations for the accounts of the 12 Federal Reserve Banks.
This is utter naivet.