Reader Peter Schaeffer writes in comments to my rebuttal to Ed Lazear that demonstrates that ex-defense GDP growth is higher under the Obama administration than during the comparable period of the G.W. Bush administration:
Excluding defense spending is contrivance. Bush spent money on defense (9-11 was in 2001). Obama has spent money on welfare. Each was a choice that a President made in response to recent events. To exclude the one and include the other may be good for scoring political points but is not good economics.
I will leave aside the dubious (and telling) assertion about welfare as well as the implied justification for all those defense expenditures arising from 9/11. (re: the former, technically, there is no welfare program, given the existence of TANF). Mr. Schaeffer then proceeds to calculate ex-Federal GDP in level and per capita terms in such a way that I cannot replicate (I’m using NIPA, he might be using something else). I hence decided to post the pictures of the data I generated (I subtract real government consumption of indicated type from real GDP, which is not exactly correct, since these are chain-weighted series. However, my experience is the approximation error is small for calculations relating to the past decade.) These graphs demonstrate that thus far GDP ex. Federal consumption spending is on track with that under G.W. Bush, in total and per capita terms; and that per capita GDP ex.-government consumption and private job creation exceeds that under G.W. Bush.
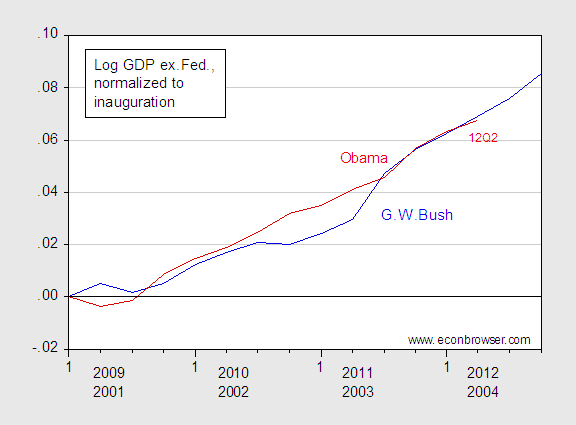
Figure 1: Log real GDP ex.-Federal government consumption spending in Ch.05$, normalized to zero in inauguration quarter for G.W. Bush (blue) and Obama (red). Source: BEA, 2012Q2 advance, author’s calculations.
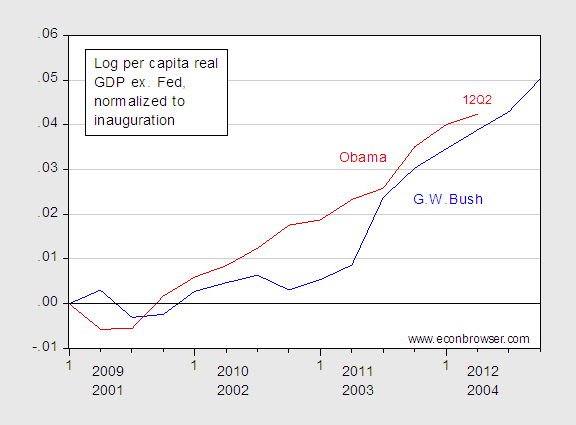
Figure 2: Log per capita real GDP ex.-Federal government consumption spending in Ch.05$, normalized to zero in inauguration quarter for G.W. Bush (blue) and Obama (red). Source: BEA, 2012Q2 advance, author’s calculations.
Now most focus is on the Federal government. But I think many people are interested in knowing the facts (as opposed to delusions) about GDP excluding spending at all levels of government. Figure 3 presents a picture of that series, comparing Obama to G.W. Bush.
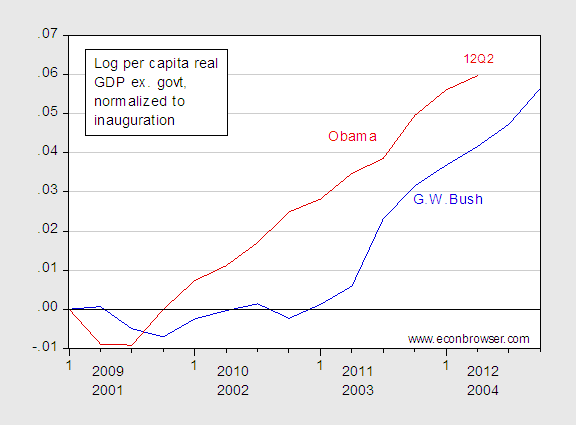
Figure 3: Log real GDP ex.-government (all levels) consumption spending in Ch.05$, normalized to zero in inauguration month for G.W. Bush (blue) and Obama (red). Source: BEA, 2012Q2 advance, author’s calculations.
What about employment? Here is private nonfarm payrolls:
.
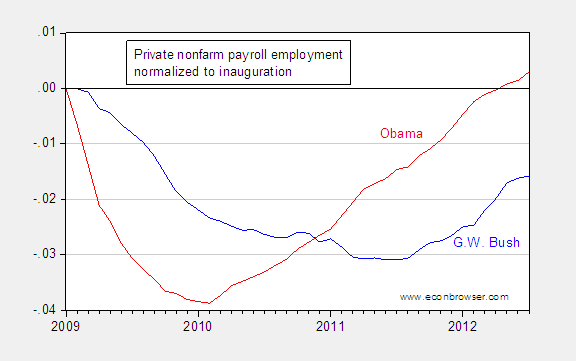
Figure 4: Log private nonfarm payroll employment, seasonally adjusted, normalized to zero in inauguration month for G.W. Bush (blue) and Obama (red). Source: BLS, July release, author’s calculations.
Now I don’t expect people like Ed Lazear (or readers like Peter Schaeffer) to be convinced, but I’m hopeful others who are able to understand and correctly manipulate data will understand what the data say.
Update, 8/10 1:45PM Pacific: Reader JLonsdale asserts I am cherry picking the data. To address this concern, I pick the normalization dates by using (as in common practice) NBER defined troughs, and re-plot Figures 1-4 (identified as Figures 1A-4A). Tell me if you think the story changes dramatically, and most importantly, why. Also, what magical dates you select as better, and why.
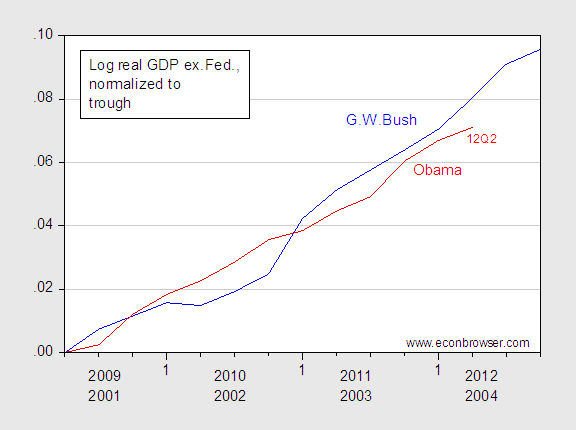
Figure 1A: Log real GDP ex.-Federal government consumption spending in Ch.05$, normalized to zero at NBER trough quarter for G.W. Bush (blue) and Obama (red). Source: BEA, 2012Q2 advance, author’s calculations.
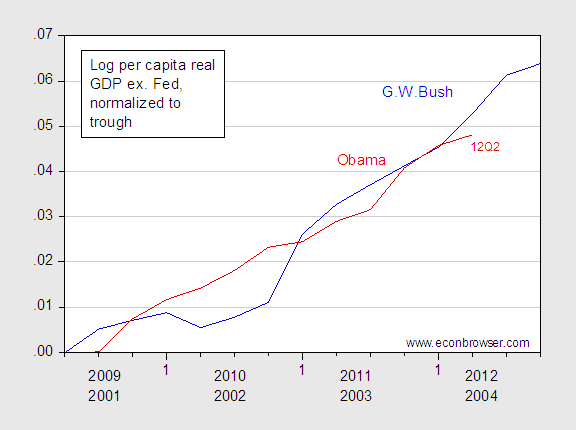
Figure 2A: Log per capita real GDP ex.-Federal government consumption spending in Ch.05$, normalized to zero at NBER trough quarter for G.W. Bush (blue) and Obama (red). Source: BEA, 2012Q2 advance, author’s calculations.
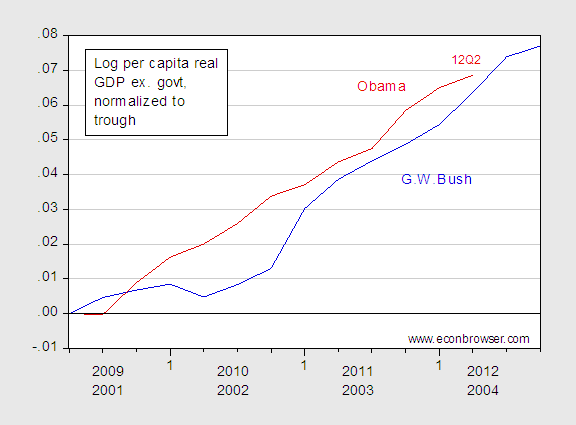
Figure 3A: Log real GDP ex.-government (all levels) consumption spending in Ch.05$, normalized to zero at NBER trough quarter for G.W. Bush (blue) and Obama (red). Source: BEA, 2012Q2 advance, author’s calculations.
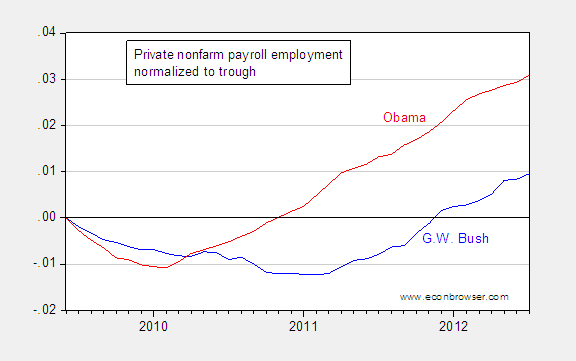
Figure 4A: Log private nonfarm payroll employment, seasonally adjusted, normalized to zero at NBER trough month for G.W. Bush (blue) and Obama (red). Source: BLS, July release, author’s calculations.
These graphs confirm Spencer‘s assertion that the results do not change much when normalizing to trough date. I wish people would use their Excel spreadsheet software before complaining; it or something comparable is on just about every computer, so software limitations are not a valid excuse.
I’m with Lazear and Schaeffer. I don’t understand.
If you make a graph of real versus potential GDP from say 1998 to the the present, you’ll see that real GDP was a bit above potential before the very mild recession, then a little below during the recession, and then tended to grow at trend until the great recession.
During the great recession, real GDP growth fell very substantially and then tended to grow parallel to trend subsequently. So, I suppose in that sense you could say that output growth under the Bush and Obama administrations have been similar.
The problem though is the large drop. Unless real GDP growth speeds up so that it converges to potential, we’ll have a permanent output gap and the unemployment rate will never fall. That convergence is what the failed stimulus plan was supposed to deliver. The dramatic failure of policy of this administration is that the output gap isn’t closing in any significant way, dooming millions of people to continuing unemployment. Let’s not let these debates about how exactly to measure GDP obscure this policy failure.
Nice charts. Rather than normalizing to the start of each president’s term, how about normalizing to the end of each president’s recession? This way one can compare their respective recoveries.
This is very apples-to-oranges, Menzie. The deficit’s sky high, unemployment is high, job growth is low, GDP growth is anemic. However we may wish to apportion blame, I think most people would not consider the current situation a success, and comparing it to Bush’s first term won’t make them change their mind.
I think you might argue a good-as-it-gets case, but even the President has failed to do that. He hasn’t laid out a road map, a clear vision for the country–and neither has Romney, really–because that road map involves choices and pain. The President’s hoping he gets a pass for trying and perfect attendance and pretending that all this will actually work long run. A good portion of the country seems willing to accept that.
My guess: It won’t be good enough, but November will tell.
To be fair, the stimulus plan was never “supposed to deliver” a close in the output gap. You might want to refer to the conservative mantra that the administration “promised” (actually, it merely predicted, in line with private forcasts) that unemployment would not exceed 8% with the stimulus. 8% unemployment would not demonstrate closed output gap.
Yeah, nice cherry-picking.
Obama was inaugurated at the depth of the downturn. Bush was inaugurated at the end of a bull run.
Honestly, publishing polemics like this I don’t see how you can expect to be taken seriously.
Rick Stryker: As you know [1], this is the latest of a series of posts contesting Ed Lazear’s characterizations. I concur that the extent of the output gap is unacceptable; and for that we have the obstructionism of those in congress who don’t even want to extend the payroll tax reduction (even though they were for it before they were against it — you know who those folks are). But I am arguing on the same grounds that Lazear is, either working off the trough, or — as in this case — working off the inaugurations.
Kosta: I did something like what you propose in this other rejoinder to Lazear.
W.C. Varones: A person who writes:
is not a person I take criticisms of cherry-picking seriously.
Here are some oil stats for you. The EIA released the STEO a couple of days ago:
US oil production is up an astounding 1 mbpd over July 2011. Canada’s oil sands provides another 150 kbpd, and Iraq provides yet another 500 kbpd. So essentially, these three countries are providing the entirety of the new oil supply.
It’s all big, bad oil: Hydrofracking, oil sands, and an invasion that, in oil terms, has proved quite successful. That’s what’s holding together the global oil system.
But even so, it’s not enough, apparently. With Brent at $114, it’s well above US carrying capacity and right at the threshold for China. I have no idea what’s supporting the price. Perhaps a bit of speculation, as a rising DOW is leading to incremental allocations of funds into energy. I would tend to be short oil at this price.
Menzie,
I am curious. Why do you always compare success to the Bush administration? Do you really believe that the Bush administration is the best baseline for success? Sorry, but I do not agree with your assumption about the Bush administration.
I did the calculation for real private GDP since the end of the recession at Angry Bear.
http://www.angrybearblog.com/2012/07/private-real-gdp-in-recoveries.html
It shows that real private GDP growth has been identical under Obama and Bush.
Using the end of the recession is the base isbased on the assumption that neither were responsible for the recessions they inherited but their policies have impacted the recoveries.
@WC- What period would you use for comparison? If you start at the recovery stage, it looks like the results are pretty much the same.
Who you gonna’ believe, Menzie’s charts or your lying’ eyes?
Professor, I’m not sure why you are stooping to this level by presenting cherry picked charts as if this version of charting tells the truth of the matter.
Your economic analysis is much more interesting than your attempts to score pointless partisan points.
It would be better if you were arguing on the side of truth (“The data they used is cherry picked. I can use slightly more reasonable assumptions and come up with graphs that show the opposite message although we should be aware that correlation is not causation.”) rather than pretending that your charts actually prove a political point.
JLonsdale and W.C. Varones: I have added four graphs. If you are still unsatisfied, please tell me what magical dates you would like plotted, and/or what magical. And don’t ask for recoveries compared against that of the Great Depression — Ed Lazear already did that one.
I do agree that arguing the types of models would be preferable, and as you know, at numerous times I have done so. But it is also useful to know what the data look like, and in that sense, is useful. You do of course know that this series started off with Ed Lazear’s stunning assertions about recoveries. He wants to condition on depth of recession; I would want to condition on whether balance sheet effects are important as well. All these can be put in a regression. But apparently, regression estimates are unsatisfying to some — so here we are looking at data.
Now I don’t expect people like Ed Lazear (or readers like Peter Schaeffer) to be convinced, but I’m hopeful others who are able to understand and correctly manipulate data will understand what the data say.
And what exactly are readers supposed to be convinced of? What’s the point and where is the conclusion? A graph by itself does not advance the conversation. Presenting graph after graph after graph is more of a distraction than anything else.
Jeff: I am not responsible for your intellectual deficiencies. Since you thought Ed “We are not in a recession” Lazear’s May 2008 statement was so defensible:
I am confident that there is nothing I can say or write that would change your opinion on anything as you appear impervious to data.
The correct comparison is who did the best with the potential they had. Coming up with a solid defensible comparison between Obama and Bush (or Reagan, or the Great Depression) requires real thought including of the creative variety. The potential in the Bush era was affected by the need to respond to 9/11 and the inheritance of the dotcom bust. The potential in either era must take into account differing monetary policy and interest rates, as these affect real growth during the time span of recoveries. The potential coming out of this recession must take into account the effect of lost housing wealth, the need to deleverage, and the broken monetary transmission mechanism. Further, the euro-crisis aftershock to the initial financial shock in 2008 is another dampener on today’s potential. On the other hand, pent-up demand was immensely greater coming out of this recession than any since the Great Depression, including the potent component of inventory rebuilding.
Another potential easily overlooked is changing long-term structural. Offshoring is arguably more growth restrictive today than ever. As is the moral, social, and cultural breakdown so evident on the evening news. Economics will remain adolescent until it recognizes its rails rest on a societal roadbed. Wash that away and the best of rails will bend under the weight of the locomotive which perforce will thereby get less traction. Welfare mentality and personal responsibility are being displaced by ever greater reliance on the state. Not to mention peak oil and global warming, that is, being farther and farther down the road from the era of cheap petroleum which lubricated the more rapid recoveries of the past.
Over against all this must be reckoned the relatively few levers to effectuate change available to a president. Fiscal policy (both size and quality of expenditures benchmarked against contribution to sustainable productivity), regulatory policy, policy changes in general as they impact growth prospects, and encouragement from the oval office for entrepreneurs and innovators, both those in business and those prospectively considering it. Or the lack of such encouragement to the point of outright stifling business spirit.
These are the bases on which I make comparisons. They necessitate understanding historical context. Addressing, measuring, and weighing these across different episodes would knock down some illusions and be a real service to the public who by and large deserve far more from economists.