Defense spending subtracted considerably; more to come if the sequester occurs. Uncertainty weighs—perhaps. Trade volumes decline. But final sales continue upward. And confusion about demand side analysis persists.
Jim has already covered the main points from the release, and further assessment is in today’s NYT. Here are some additional observations.
Defense Drawdown and GDP Growth: The Shape of Things to Come?
Defense spending accounted (in a mechanical sense) for 1.28 ppts of the -0.1 ppts growth (SAAR) recorded in Q4.
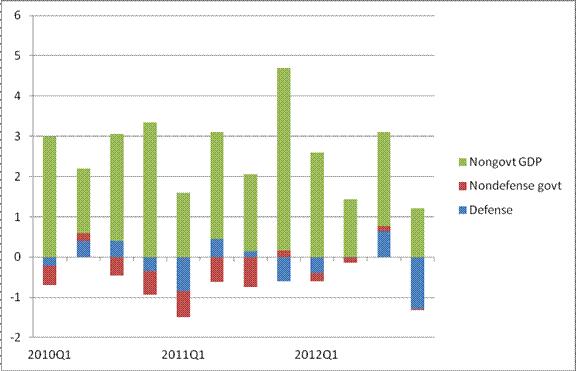
Figure 1: Contribution to GDP growth, q/q SAAR, from defense spending (blue), nondefense government spending (red), and nongovernment GDP (green), in percentage points. Source: BEA, 2012Q4 advance release, and author’s calculations.
Defense spending on goods and services declined 42.36 billion (Ch.05$), or $46.8 billion, at an annualized basis going from Q3 to Q4. This was a 22.15% (SAAR) (25.04% in log terms).
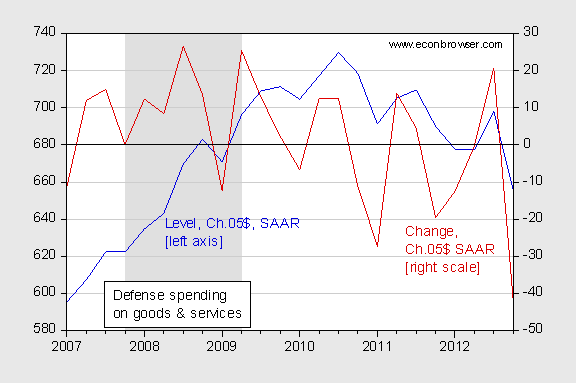
Figure 2: Defense spending on goods and services (blue, left axis), and change in defense spending (red, right), in bn. Ch.05$ SAAR. NBER defined recession dates shaded gray. Source: BEA, 2012Q4 advance release and NBER.
In an interesting comment, JEC chair-designate Brady stated:
“This stunning contraction can’t be blamed simply on defense spending ahead of sequestration or uncertainty over the fiscal cliff. It’s a case of acceleration.
Defense spending was accelerated into the third quarter of last year which artificially boosted the economic growth ahead of the November election to 3.1%. As a result, the fourth quarter sagged into a 0.1% decline. Sequester is not to blame – defense spending in the last two quarters averaged about the same as defense spending in the first half of the year.
As Figure 1 illustrates, defense spending accounted for only 0.64 ppts of growth in Q3, while the drop in Q4 was 1.28 ppts. The decline is clearly larger than the prior increase.
Further, his comment about artificial boosting of growth is telling; it only makes sense in a Keynesian framework. In a Classical or Heritage Foundation perspective, the amount of defense spending would not matter to overall GDP growth. But perhaps internal consistency is the hobgoblin of small minds like mine.
Given Representative Ryan’s assessment that sequester is likely to go through, [1] then one can trace out the implications for growth going forward. In 2013, defense spending will be reduced by about $55 billion (and nondefense by about $55 billion) above and beyond what was previously planned, by virtue of the sequester. Since the GDP deflator in 2012Q4 is about 16% higher than in 2005, then the $55 billion reduction translates to about 47.4 billion (Ch.05$). If the entire reduction is taken in Q2, then one would have around 1.4 ppts shaved off of Q2 growth, in a mechanical accounting sense. This ignores the Keynesian effects that Representative Brady was alluding to. And of course, the defense portion is only half of the total sequester. (We can only hope that Representative Ryan is as good at predicting political outcomes as inflation outcomes.)
Uncertainty Weighs?
JEC chair-designate Brady has stated that uncertainty could not be the reason for the decline in output, contra the CEA. While I believe other factors –-including low aggregate demand from fiscal drag and declining foreign demand –- matter more, I wouldn’t a priori rule out a role for policy uncertainty. Consider the trajectories of GDP growth and policy uncertainty as measured by Baker, Bloom and Davis:
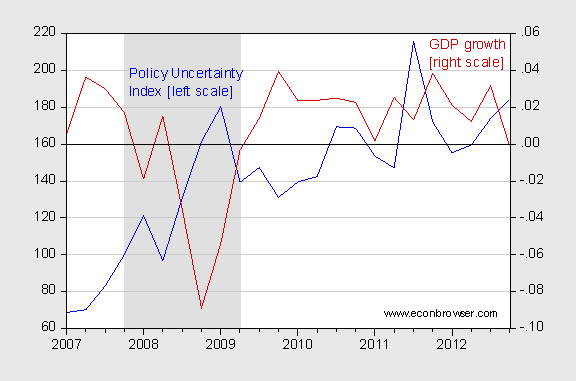
Figure 3: Policy uncertainty index, quarterly average of monthly values (blue, left axis), and real GDP growth rate, in ppts SAAR (red, right). NBER defined recession dates shaded gray. Source: BEA, 2012Q4 advance release, policyuncertainty.com, NBER.
Now, it must be noted that GDP growth was probably depressed by around 0.5 ppts by Hurricane Sandy. Even then growth would be only about 0.4 ppts abstracting from that shock. So, after accounting for lags, I don’t see how Representative Brady can rule out the impact of policy uncertainty a priori, given Figure 3. For discussion of how policy uncertainty could be important, and how continued obstruction on the debt ceiling could impact activity going forward, see this post.
Trade Volumes Decline
Exports accounted for -0.81 ppts of growth. It is conventional to associate export growth with foreign demand (and competitiveness as measured by the real exchange rate). One could argue domestic supply constraints could be the cause. However, the concurrent downturn in imports suggests global factors at play (the IMF WEO update released a week ago documents the outlook abroad).
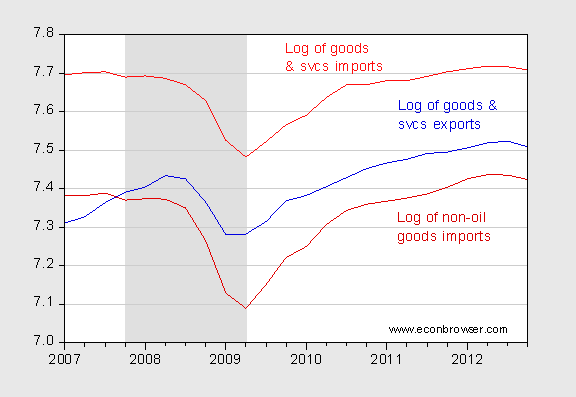
Figure 4: Log goods and services exports (blue), non-oil goods imports (dark red), and goods and services imports (red). NBER defined recession dates shaded gray. Source: BEA, 2012Q4 advance release, NBER, and author’s calculations.
It’s important to recall that the Q4 advance release incorporates only two month’s worth of trade data. Consequently, there is greater uncertainty regarding these numbers than some of the others.
Thus, while I am sympathetic to the view that internal sources of demand (consumption, investment) will tend to carry forward the economy, I worry that slowing foreign demand will prove to be a measurable drag. (Of course, in the Classical model or the Heritage worldview, higher export demand would only crowd out domestic sources of demand, so from the standpoint of 214 Mass. Ave, NE, nothing to worry about).
Finally, it is important to note that the trend final sales of domestic product deviates substantially from GDP. That is an implication of the drawdown in inventories, which accounted for -1.27 ppts (SAAR) of 2012Q4 growth.
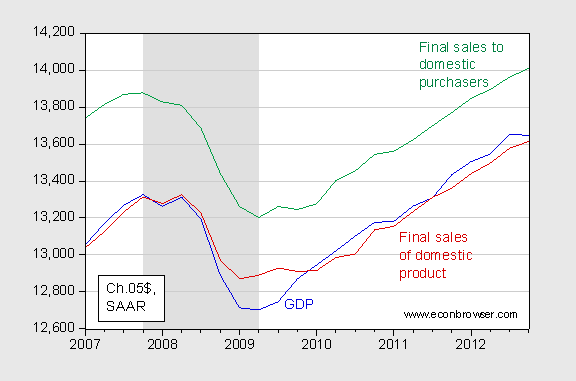
Figure 5: GDP (blue), final sales of domestic product (red), and final sales to domestic purchasers (green), bn. Ch05$ SAAR. NBER defined recession dates shaded gray. Source: BEA, 2012Q4 advance release and NBER.
Note that final sales to domestic purchasers grew 1.3% SAAR, demonstrating continued momentum in demand (albeit of a modest nature). (The December m/m real consumption growth at 0.2 ppts (not annualized) is still fairly robust, given that consumption was abnormally high due to Hurricane Sandy’s impact.)
Concluding Thoughts
So, there are reasons to be optimistic on the basis of economic fundamentals, despite the drop in GDP. However, I am confident that with enough obstinacy on raising the debt ceiling and addressing the sequester, we can still endanger the recovery.
Rep. Brady: Defense spending was accelerated into the third quarter of last year which artificially boosted the economic growth ahead of the November election to 3.1%
What a moron. Defense spending for 2012Q3 GDP numbers reflects FY2012Q4 spending for the fiscal year. How exactly did the Pentagon pull forward spending across fiscal years? Did Congress mysteriously increase the O&M budgets for FY2012Q4? Or am I supposed to believe that this clueless congress critter thinks the fiscal year budget authorizations track with the BEA’s GDP calendar year reporting??? With idiots like this running the show I’m sure there is every chance that “we can still endanger the recovery.”
I don’t know… I think it’s that illegitimate bastard Walker’s fault for this country’s GDP problem.
2slugs points out something I’ve noticed other bloggers missing: the federal fiscal year runs from 10/1 to 9/30. It isn’t possible that defense spending was moved from FY2013 into FY2012. I was going to say that a Congressman should know better but then I realized the point is not honesty but scoring cheap political points.
2communistbait
my ultralib friends say the same thing. They said that unspent money left over from Q3 and Q3 (fiscal) was spent in Q4 from a use it or lose it rationale.