On Friday the benchmark crude oil traded in the central United States (West Texas Intermediate) sold for the same price as the benchmark European crude (Brent). That’s the first time that’s happened in almost three years. But I don’t expect the situation to persist.
 |
Brent and WTI are very similar products, and historically sold for essentially the same price. But surging production from Canada and the central United States overwhelmed capacity to transport crude out of the hub in Cushing, Oklahoma where existing pipelines carry it. The result was that U.S. refineries on the coast paid the high world price for imported crude, lacking a cheap way to access the product landlocked in Cushing.
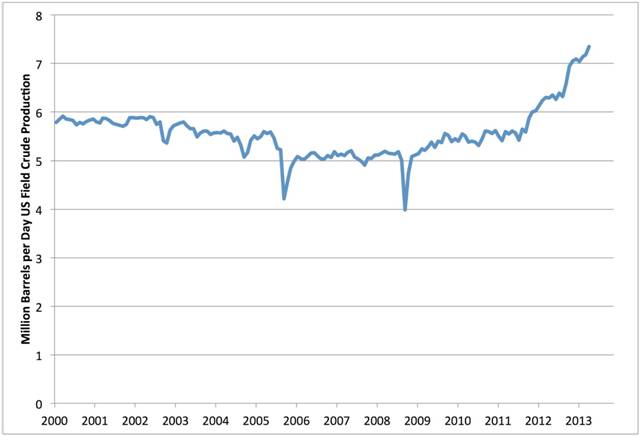 |
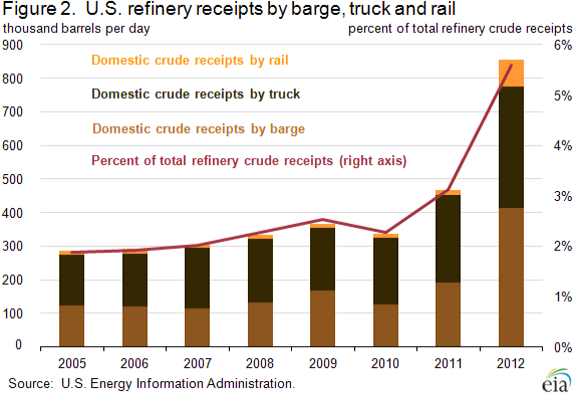
Since 2010, infrastructure for transport and delivery of crude to U.S. refiners by rail and barge has grown tremendously. This has narrowed the Brent-WTI spread, but is not enough to eliminate it, since pipelines are an economically more efficient (and environmentally more friendly) way to transport oil.
 |
 |
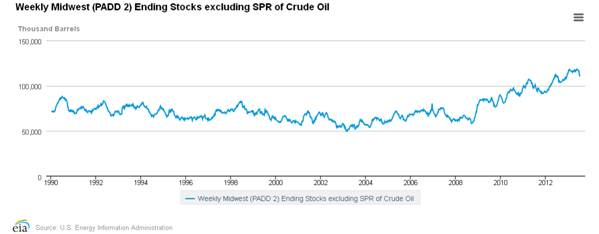
Pipeline infrastructure to deliver more crude oil from the central U.S. to coastal refineries is gradually coming on line. The recently reversed Seaway Pipeline has been carrying an estimated 300,000 barrels a day out of Cushing, and its operators hope to twin it with a second line upping the capacity to 850,000 barrels a day by the end of next year. The reversed Magellan Longhorn pipeline (225,000 b/d capacity) has started carrying crude directly from west Texas to Houston refineries, bypassing the glut in Cushing. Also helping relieve the glut has been the completion of improvements to BP’s refinery in Whiting, Indiana, which is now using close to 400,000 b/d of the surplus crude. All this has helped to finally draw down inventories of crude oil in the Midwest to the levels seen in December, though there’s still a long way to go.
 |
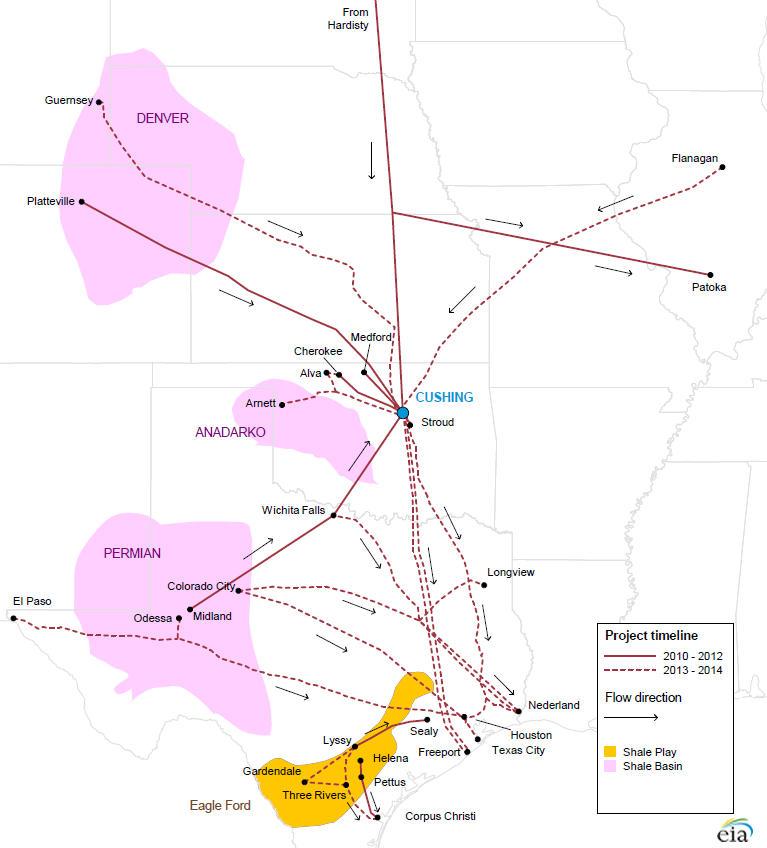
The Gulf Coast leg of the Keystone project, which can carry an additional 700,000 b/d from Cushing to the coast, is expected to begin operation by the end of the year. But other projects will also likely soon be bringing even more oil from Canada and the U.S. into Cushing. These include 600,000 b/d from the South Flanagan project and another 800,000 b/d that could be delivered through the proposed Canada-to- Nebraska leg of the Keystone project. The latter may never be approved, but the former simply twins an existing line within the United States. Other projects are also underway that would bring even more oil into Cushing. All of this means that the elimination of the Brent-WTI spread may prove to be a short-lived phenomenon.
 |
In any case, although infrastructure for transporting crude within the U.S. is still inadequate, pipelines for refined products like gasoline are better, which means that refined products sell for the same price in America as elsewhere in the world. This is the reason that U.S. gasoline prices tend to track Brent more closely than WTI. A rule of thumb that’s held up pretty well is that the retail price that Americans pay for a gallon of gasoline goes up about 2.5 cents for every $1.00/barrel increase in the price of Brent.
 |
Here’s a little calculator you can use to get the predicted gasoline price plotted in blue in the graph above; just enter the current price of Brent to see the predicted gasoline price. The long-run relation says that, based on the current price of Brent at $108.07/barrel, we’d expect the average U.S. retail gasoline price to be about $3.54/gallon. That suggests that U.S. gasoline prices might soon fall by about 14 cents/gallon.
Here's a self-updating reference to the current Brent price if you want to come back to this page to recalculate the expected U.S. gasoline price as the price of Brent changes.And here is a self-updating plot of the average U.S. retail gasoline price so you can come back to see if I was right.
| New Jersey Historical Gas Price Charts Provided by GasBuddy.com |
In any case, I suspect that the days of the really big Brent-WTI spreads are over.
The Mid-continent refiners had a great run for a couple of years–buying crude at WTI prices and basically selling product at Brent prices.
Regarding US oil & gas production, I think that what almost everyone is missing is the significant increase in the decline rates from existing production.
I suspect that the decline rate from existing US crude oil production is in the vicinity of 10%/year, and increasing, as an increasing share of US crude oil production comes from high decline rate tight/shale plays. At a 10%/year decline rate, in order to maintain the current US crude oil production rate for 10 years, the US would have to replace the productive equivalent of every US oil field over the next 10 years.
Citi Research recently issued a report which put the decline rate from existing US natural gas production at about 24%/year. At a 24%/year decline rate, in order to maintain the current US natural gas production rate for four years, the US would have to replace the productive equivalent of virtually all current US natural gas production over the next four years.
A case history from the Barnett Shale Play, in Texas (MMCFPD = mmcfpd = million cubic feet per day, cfe refers to natural gas + natural gas liquids converted to gas equivalent):
A couple of items follow, emphasis added, from 2007 regarding Chesapeake’s DFW Airport Lease, in the Barnett Shale Play.
In 2007, Chesapeake estimated that late 2011 production from the lease would be up to 250 MMCFPD, and they estimated that production would continue for at least 50 years. In 2007, they also said that the lease ” likely contains one of the thickest and best-developed reservoir facies anywhere in the play.”
Actual late 2011 production from the lease was only about 35 MMCFPD. Of course, the sharp decline in gas prices had an impact on drilling, but it’s interesting to take a look at how the wells that Chesapeake drilled and completed on the lease in 2007 have done over the past few years. (That info is found below.)
Chesapeake Announces First Natural Gas Production from Dallas/Fort Worth International Airport Lease with Initial Sales of 30 mmcfe Per Day from First 11 Barnett Wells (October, 2007)
(Search for above title for link)
(End Excerpt)
And here is an item from the July, 2007 American Oil & Gas Reporter:
Chesapeake Images Barnett Shale Beneath DFW Airport
(Search for above title for link)
(End Excerpt)
Update on Wells Completed in 2007
The DFW Airport Lease had production of 52 MMCFPD in January, 2008, which would presumably be attributable to the 21 wells drilled and completed in 2007. The wells still producing from the 2007 group produced 2.6 MMCFPD in April, 2013 (with 10 of the 21 wells already having been plugged & abandoned).
This is about a 95% simple percentage decline in a little over five years, or an exponential decline rate of about 60%/year in monthly production (2007 wells only).
Total cumulative production from the 21 wells completed in 2007 appears to be 16.5 BCF, or about 0.8 BCF per well, after a 95% decline in production from January, 2008. Note that Art Berman puts the average EUR per well on the DFW Airport Lease at about 0.9 BCF per well.
It does seem that Chesapeake’s proclamation that the DFW Airport gas wells would produce gas for at least 50 years is a “little” on the optimistic side, especially since about half of the wells that they publicized in 2007 have already been plugged and abandoned. Odd that they did not issue a press release about that.
Here’s a thought experiment. Assume that the 21 wells they put on line on the DFW Airport Lease in 2007 were the total gas supply for the country. In a little over five years, our total gas supply would have dropped by 95%. This is the revolution that will power us to a virtually infinite rate of increase in oil and gas production?
Not so sure WTI will again diverge so markedly from Brent.
Canada’s oil sands production is being challenged by high costs, and Canadian oil production is actually down from recent highs (some weather-related).
Using technical analysis, the Bakken looks like it has about another 150 kpbd until it peaks in late 2016. So growth will be decreasing rapidly in that play.
The Eagle Ford and Permian are much nearer to Houston and have substantial existing infrastructure.
I’m prepared to be wrong about this, but I would expect WTI to track Brent more closely in the future.
Here’s something to consider:
– Europe is in recession
– Japan is relatively weak
– US GDP growth looks to be 1.0% in Q2
– China is wobbly, and growth there may be only 3-4%
And Brent is at $108.
Is that the good news or the bad news?
The biggest issues that Americans need to examine is the profitability of shale and the decline rates of existing fields. It should be clear to everyone by now that shale gas was a total disaster for producers. Billions have been written off and many more billions will follow. The picture for shale oil may not be much better because the SEC filings are showing massive explosions of debt and continued negative cash flows even for companies that have been producing shale oil for a while. The ND data also shows us the true state of the industry. Even though we saw around $17 billion in drilling to increase the number of horizontal wells by around 43% the average production rate per well FELL by 10% to 130 bpd. To understand what this means we have to keep in mind that shale wells produce about half of their oil in the first three years and have the greatest production rate in the first year. While we could see the average rate go back up to around 140 that is nowhere near what is required to show that shale oil is profitable.
I find it strange that so many intelligent analysts forget that one of the keys to the natural resource sector is turning resources into reserves. To do that there are several steps that must be taken and reported. Sadly, the rules that apply to copper, gold, or conventional oil exploration do not apply to shale exploration and development. Even though shale formations are not very uniform companies are allowed to make certain assumptions about how much wells in a given area will produce without having to prove it by having a number of wells that can verify those assumptions. It is my guess that some time in the next year or two reality will begin to intervene and we will see several companies having to write down the value of the assets on their balance sheets. At some point the lenders will finally figure out that they will not get paid and they will try to get rid of their problems by securitizing energy loans and selling them off to the usual patsies or will demand another bailout from the government. At that point all the analysts who were hyping shale without looking at the details clearly shown in the filings will be suggesting that the people who ‘misled them’ should be sent to jail.
Steven Kopits,
– US GDP growth looks to be 1.0% in Q2
– China is wobbly, and growth there may be only 3-4%
I am amazed that people still make the error of considering ‘real’ GDP, rather than nominal, when making such estimations.
Oil demand (as well as corporate earnings, revenue, etc.) is governed by Nominal GDP, not ‘real’ GDP, which is a metric that is totally useless on a quarterly basis (it is only useful in longer-term calculations).
Regarding annual Brent crude oil prices, we have so far seen a cyclical pattern of higher annual highs and higher annual lows, since 1997. Here are the three year over year declines in annual Brent crude oil prices since 1997, along with the rates of change since the 1998 low:
1998: $13
2001: $25 (+22%/year)
2009: $62 (+11%/year)
If the 2013 annual Brent crude oil price declines to the current price of $108, this would be a +14%/year rate of change, relative to the $62 price in 2009, which would be between the 1998 to 2001 and 2001 to 2009 rates of change.
Jeffrey J. Brown at July 22, 2013 05:31 AM and Steven Kopits at July 22, 2013 06:05 AM: I agree, and should have been more clear. The Brent-WTI spread is not going back to $20/barrel. But I would not be surprised to see the spread back to $5/barrel by the end of next year.
Bruce Hall: I would say it is overall good news in the sense that we are finding more efficient ways to get the product to where it is most valuable. But as with any change, there are winners and losers. Winners include North American oil producers, coastal refiners, railroads, and consumers. Losers are Midwest refiners.
Thanks – very useful.
Solid work, thanks, give you a plus. WTI will track Brent more closely in the future, yes. The future is bright.
JDH,
But I would not be surprised to see the spread back to $5/barrel by the end of next year.
Well, that is pretty long-term. 18 months.
Since the spread compressed from $6 to $0 in just 3 weeks, the reverse can also happen that quickly. This could be useful from a trading point of view.
The collapse from $20 to $6 was more fundamental. The $6 to $0 and back to $6 will be faster.
We are looking at effectively perfect substitutes which have been historically priced a varying differentials to one another; why is that? is still a rational question although thinking that the answer will not continue to change over time is highly irrational.
Dating back to the 90’s, WTI futures for prompt delivery carried an average premium of $3/bbl over the 1st nearby Brent contract. When crude was trading at $25/bbl, this was financially a 12% premium to the international marker for light sweet crude. At $15/bbl and the same spread in dollar terms, this was a higher premium in % terms; at $30/bbl it was the opposite. The reason for WTI’s prevailing premium is financial in nature because we are dealing with financial contracts that drive the physical market(see exchange of future for physical). The prolonged reversal of this spread is also the result of financial conditions which in turn drives physical market conditions in line.
We have to accept the Brent premium as no less reasonable than a WTI premium; therefore when nearby Brent futures were priced at $110/bbl and traded at a $15/bbl differential to the prompt WTI contract, the 13.5% premium was financially in line by historical measures. In reality, the headline price that is obsessed over is largely irrelevant on its own. Oil backed-secured funding agreements are the most important transactions in the physical arbitrage market. Expectations of changing short term financial conditions have likely impacted the WTI and Brent forward curves through these transactions.
Steven and Jeffery,
What is your assessment of Australia’s Arckaringa Basin shale oil discovery?
Art Berman took a lot of arrows for his call on the Barnett. He lost is column at World Oil and was excoriated by one of the investment banks.
And, of course, Art was right.
Regarding the Arckaringa Basin, I think that a blogger named “GarryP” had a very good analysis (emphasis added):
http://britishexpats.com/forum/showthread.php?t=803665
GarryP
Professor Hamilton and Steven Kopits,
In regard to our mutual acquaintance Ed Morse, I thought you might find the following interesting. An excerpt from an email I received (emphasis added):
In regard to Ed Morse’s somewhat belated discovery that tight/shale plays have high decline rates, here is a link to and an excerpt from a March, 2012 WSJ OpEd piece by Mr. Morse:
http://online.wsj.com/article/SB10001424052702304459804577285972222946812.html?mod=WSJ_Opinion_LEFTTopOpinion
Move Over, OPEC—Here We Come (March, 2012)
In energy, North America is becoming the new Middle East. The only thing that can stop it is domestic politics.
Ed was always an optimist on supply.
Our numbers right now suggest the shales oils have another 1.4 mbpd in them to peaking, sometime in, say, mid-2016 or so.
I am penciled in to speak at the CSIS in DC on the 7th on “Reaching the Limits of America’s Energy Boom”.
We’ll see if the date solidifies, but I’ll add my two cents’ worth if it does.
In my opinion, Art Berman is to shale play economics as Meredith Whitney was to the financial crisis. In both cases, they were heavily criticized, but subsequent events and data have largely supported their warnings.
And of course, Meredith has been warning, for a while, about local and state government finances. She was just on CNBC warning that Detroit’s bankruptcy is just the beginning. In the interview, she differentiates between regions doing relatively well, e.g., the oil & gas producing areas, and the areas not doing well, e.g. Detroit.
My 2¢ worth, using my “Export Land Model.”
The GELM (Government Export Land Model)
Let’s think of local and state (provincial), and for that matter, national governments as being similar to oil exporting countries, in that they consume a percentage of tax revenues and net debt infusions, in order to pay current benefits to employees and operating expenses and to pay current and future retirement/health benefits.
And let’s just really focus on current and future retirement benefits.
As Michael Lewis noted in his recent book, “Boomerang,” a lot of local governments, especially in California, are on track to consist of little more than a small staff that collects taxes and forwards virtually all tax revenue to retirees. And of course, most public pension systems are assuming a (highly unrealistic) estimate of 7% to 8% on future annual returns. Of course, the lower the actual investment return, the larger the unfunded pension obligation.
In any case, if we assume flat to declining tax revenue, combined with rising retirement obligations (especially as investment returns continue to disappoint), it seems to me that the net result would be an accelerating rate of decline in services provided to the taxpayers, perhaps even as governments try (probably) unsuccessfully to materially raise tax revenue, by raising tax rates.
From an Amazon review of “Boomerang”
Here is another interesting chart,
http://jacquessimon506.files.wordpress.com/2013/07/bakken-wti-basis-assessment.png
The pieces of the puzzle are in place for a steep fall in oil prices in the next 18 months:
– rising US production
– improving fuel economy, and sluggish economic growth/ stagnation in developed countries (especially Europe, USA to a lesser extent)
– falling demand growth due to economic slowdowns in emerging markets (China, etc.)
– reduction of oil price subsidies amongst some major consumers (India, Egypt etc.)
– continued development of Iraqi oil reserves
– existing frontier oil E&P activity coming into production (Africa etc.)
– difficult the Saudis have in reducing production given their budgetary targets
– substitution at the margin by natural gas for electricity (small, but potentially larger in some emerging markets), transport etc.
We could see $60/bl oil easily. At which point the high cost producers, like Canadian tar sands, are in trouble. The Saudis may not be able to cut production that quickly and a relatively small oversupply could trigger a big price fall (probably as little as 1-2m b/d oversupply).
Note there are increasing issues re calculation of Brent Crude price due to falling production. And there are potentially looming scandals re market manipulation of key contract prices as per LIBOR and British natural gas prices.