Despite the best efforts of some policymakers to reduce aggregate demand by way of austerity measures [0], there are glimmers of hope for more rapid growth.
2013Q3 q/q GDP growth has been revised up to 4.1% SAAR; higher consumption is part of the reason. The impact on the path of GDP is noticeable.
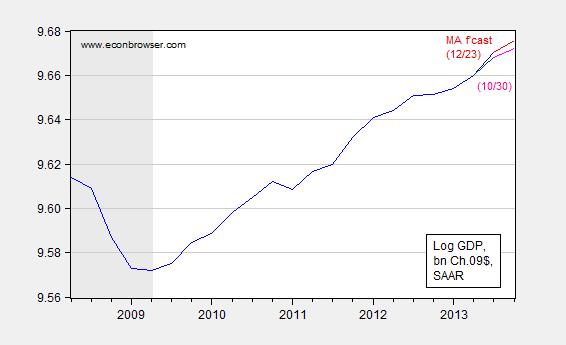
Figure 1: Log GDP, December release (bold blue), October release (dark blue), Macroeconomics Advisers forecast of December 23 (bold red), and forecast of October 30 (pink), all in billions Ch.09$, SAAR. NBER defined recession dates shaded gray. Source: BEA 2013Q3 advance and 3rd release, NBER, and Macroeconomic Advisers.
Notice that not only has the trajectory of GDP moved up noticeably, the forecasted growth rate for 2013Q4 has moved up. The IMF is also revising upwards forecasted growth for the US in 2014. [1]
Employment seems to be growing more rapidly. In addition to the acceleration in November employment growth, it’s likely that the benchmark revision, to be reported in February 2014, will shift up the trajectory of nonfarm payroll employment and private nonfarm payroll employment. For the first, Figure 2 shows the likely revision, based upon the preliminary benchmark revision (released 9/26).
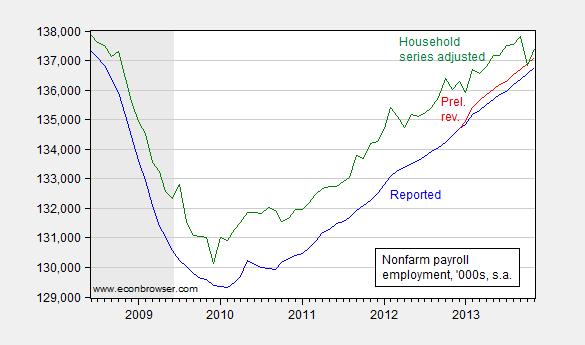
Figure 2: Nonfarm payroll employment as reported (blue), preliminary revision for March 2013 (red), and household employment series adjusted to conform to payroll concept (green). Source: BLS via FRED, BLS, BLS, NBER, and author’s calculations.
Notice that the household adjusted series matches the revised payroll series toward the end; however, the household series is subject to considerably wider variation due to smaller sample, so not too much should be made of this.
Private nonfarm payroll employment shows a similar phenomenon.
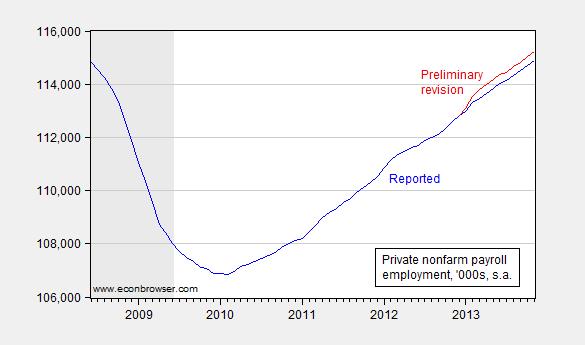
Figure 3: Private nonfarm payroll employment as reported (blue), preliminary revision for March 2013 (red). Source: BLS via FRED, BLS, NBER, and author’s calculations.
Finally, indicators of production show an acceleration of growth.
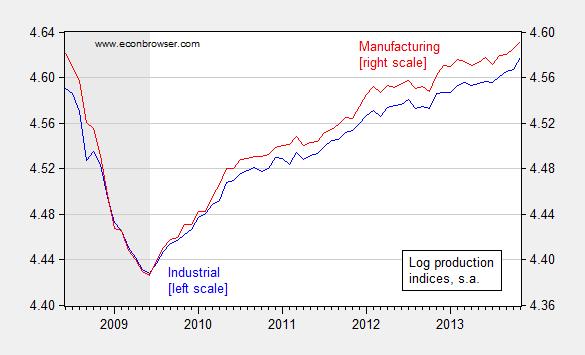
Figure 4: Log industrial production (blue, left scale), log manufacturing production (red, right scale). NBER defined recession dates shaded gray. Source: Federal Reserve Board vis FRED, NBER, and author’s calculations.
Other forward looking indicators are positive; today’s CFNAI release indicates a shift from contraction (-0.06) to expansion (0.7). Consumer sentiment has also increased, according to the Reuters/UMich index.
Finally, I think the factor that makes the growth more likely to be sustainable going forward, barring another debt-ceiling crisis or some sort of financial crisis overseas, is the fact that real household net worth has nearly reattained pre-crisis levels.
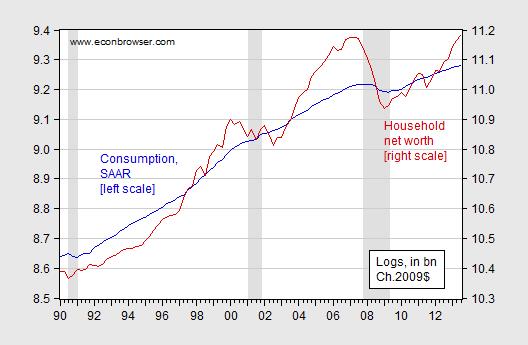
Figure 5: Log real consumption, bn Ch.09$, SAAR (blue, left scale), and log real household net worth, bn Ch.09$ (red, right scale). Net worth deflated by PCE deflator. NBER defined recession dates shaded gray. Source: BEA and Federal Reserve Board via FRED.
Despite these positive notes, in this season, it would be wrong to forget those that the recovery has left behind, and particularly those whom some of our policymakers [2] have decided would be better off without our help — namely the 1.3 million long term unemployed who will receive their last unemployment benefit checks on December 28. [3]
So to all — even those who are happy to see extended UI and SNAP cut — a happy holidays.
Menzie, Ok, but how does this fit into all this talk about secular stagnation? It looks like a U-shaped recovery (not V-shaped, but still going up), and we should be getting back to normal pretty soon. Are you implicitly disagreeing with Summers/Krugman etc.? What do these data make you believe about the secular stagnation hypothesis?
there are negative deflators in place for goods consumption, so real goods PCE in October and November have been growing at a double digit annual rate…2 months this quarter already exceeded the 3rd quarter..that’s 23% of GDP…
One thing that may have been overlooked is that when a middle class person retire they become consumer class to the extreme. They go from having put a certain % of their money away into investments (retirement accounts), to consuming not only all their income (investment income) but also part of their savings.
Our current problem is that way to much money is going into investment/savings and not enough is going into demand/spending. The retirement of baby-boomers may help with that imbalance and provide an unexpected boast to the economy.
Happy holidays to you, too, Menzie.
Happy Holidays to you, too, Menzie! Thanks for an informative year of blogging. This random worker may not be the sharpest knife in the drawer, but he appreciates the time you take to help educate the public.
The random worker unscientific “Brokerage Customer Optimism Scale” is trending upwards! About 4 years too late! Oddly, we have had many customers this year remain in their basements, shivering and clutching their dried beans and gold coins. But they are starting (starting!!!) to thaw out a little bit. We might see some come up out of the dark soon. Hopefully for them it’s not too late.
Earlier this year we had clients call up in horror demanding we sell everything health care related because of communism. Of course we accommodated their requests.
Those that didn’t buy into the panic can see their VHT up 40% ytd! And those that did panic might be coming down off the ledge now that they can see good returns advertised in Fortune magazine again. That’s why I agree with you…there is optimism in the air! That is not to say all is well in both Americas. We still have much work to do. I, for one, am committed to help find jobs for those random relatives who still need them.
Best wishes to all the regulars. Thank you for keeping it interesting around here!
Regards.
Is there any reason to believe a positive wealth effect may push growth above 3% next year? Gains in household net worth of the magnitude experienced in 2013 should lead to a considerable jump in spending…but its a brave new world, perhaps old elasticities don’t hold anymore.
What would you suggest for sensible guidelines for counter-cyclical spending, both in the lows and the highs?
Speaking of optimism, stock market bullishness is at an extreme, with one bearish sentiment indicator at the lowest level in its history going back 25 years, and at the lowest level since before the 1987 Crash.
http://3.bp.blogspot.com/-T1i9qwajt3U/UpwvpV5mxSI/AAAAAAAASb0/dnUwMhROJn4/s1600/II+Bears.png
http://www.aaii.com/sentimentsurvey
http://blogs.marketwatch.com/thetell/2013/12/12/investor-bullishness-looks-horrifying-according-to-this-chart/
http://greedometer.tumblr.com/post/69625602145/advisors-hit-new-all-time-record-for-bullishness
http://www.investorschronicle.co.uk/r/…/IC/Assets/…/Sentiment%20Tactics.pdf
http://stockcharts.com/h-sc/ui?s=$CPC&p=D&yr=3&mn=0&dy=0&id=p83181309503
http://stockcharts.com/h-sc/ui?s=$CPCE&p=D&yr=3&mn=0&dy=0&id=p33456923405
Reported earnings and revenues have been flat for over two years, whereas the S&P 500 is up 60-65%, and the P/E has expanded 50%. The only two times in the 142-year history of the S&P 500 when a similar situation occurred with real reported earnings having contracted yoy along the way was in 1986-87 and 1928-29.
Shiller’s 10-year average P/E is above the levels historically when secular BULL MARKETS PEAKED (1881, 1929, and 1966-68) and thereafter experienced secular bear markets lasting 15-16 to 20 years. Even a best case scenario implies a ~0% real total 10-year return (before fees and taxes) and cyclical drawdowns of 35-50%+ in the meantime.
The speculative leveraged meltup we have seen since summer-fall 2012 (Fed’s “all in”) is one for the history books, if not one for which the history books must be rewritten.
http://stockcharts.com/h-sc/ui?s=$NYHILO&p=W&yr=3&mn=0&dy=0&id=p40612045936
http://stockcharts.com/h-sc/ui?s=$NYSI&p=W&yr=3&mn=0&dy=0&id=p80316387638
Fewer stocks are participating in the meltup.
Despite Wall St. (that depends upon inflating bubbles), Fed officials (who work for the TBTE banks and Wall St.), and establishment economists (who serve the TBTE banks, the Fed, and Wall St.) claiming that there are no bubbles anywhere (or they are incapable of seeing, or are not permitted to see, bubbles), there are bubbles ABSOLUTELY EVERYWHERE (because the Fed/TBTE banks intended there to be bubbles):
Stocks
Non-financial corporate debt to GDP
Real estate, including in China, Asian city-states, Canada, Australia, parts of Europe, and the oil emirates
Wealth and income concentration to the top 0.01-0.1% to 1-10%
Equity market cap to GDP
Q ratio
Trophy properties
Farmland
Teslas
IPOs
NYSE margin debt
Stock buybacks
Derivatives to GDP
Total debt to GDP
Art
Vintage cars
Student loans and college tuition
Subprime auto loans
Bank reserves
Bank assets to GDP
Fed balance sheet to GDP
Professional athlete and CEO compensation
Professional sports franchise prices
Tight oil extraction and exports
There is also a bubble in the number of people claiming that there are no bubbles anywhere.
The bubbles are global and cumulatively far larger than anything experienced in history, even larger in scale globally than in 1999-2000 and 2006-07.
The bubbles, Fed printing, bank cash hoarding, and the resulting EXTREME wealth and income concentration to the top 0.1-1% to 10% is contributing to money velocity plunging and the pricing of Millennials out of the housing market, causing household formation to collapse.
Bears have been in hibernation for so long (as in 1999-2001 and 2007-08) that no one remembers where their caves are or if they are any still alive. The bulls have only themselves left to trample in the next stampede out the exits (when, not if, it occurs) when the TBTE bankers finally decide to pull the plug on (or deflate) the bubble, as they always do.
Reason for optimism or unreasonable optimism by the top 0.01-0.1% to 1%?
A friend sent me the following email.
The inability to see that the current monetary policy does not work in any mechanically rational way is embedded in the culture of the professional and academic community. There is an orthodoxy of thought in all the elite institutions of learning and then in all the government and private applications of that learning. This group think will not change, as Schumpeter explained, until all the old heads of academic economic departments die and a new generation can impose a new orthodoxy. Professors and Central Bankers, who have spent their whole lives writing papers and books from an Aggregate Demand, Quantity Theory of Money point of view, are not capable of mentally confronting the possibility that everything they learned and taught for their whole lives might be wrong.
All the cherished beliefs of a generation that low interest rates stimulate economic activity, that increasing the quantity of money will increase bank loans and inflation, or that the economy’s growth can be judged by the level of government spending and consumption, are exposed as intellectually bankrupt myths, are not effective in structuring policy, but the current orthodoxy makes it culturally and professionally impossible to admit that.
“2013Q3 q/q GDP growth has been revised up to 4.1% SAAR; higher consumption is part of the reason.”
Yes, higher consumption of healthcare and gasoline.
http://www.zerohedge.com/sites/default/files/images/user5/imageroot/2013/12/Personal%20Consumption%20Expenditures.jpg
Or is zerohedge lying again?
XO: My earlier assessment still stands; it’s just that there are some reasons to believe the output gap will actually shrink.
Regarding the secular stagnation thesis, well I still wonder whether this is merely a reflection of the lack of political will to sustain government spending and transfers at levels sufficient to push the equilibrium real rate above zero.
Ricardo: Sounds like a poor imitation of Kuhn. Suggest you read his Structure of Scientific Revolutions.
Anonymous: I think zerohedge usually reproduces numbers correctly, but the interpretation is usually — to me — a bit iffy. In this case, those nominal numbers seem correct. But the figures that I focused on are real magnitudes. I believe upward revision in real health expenditures did account for an important share of the upward revision in overall consumption.
Hi Menzie,
You may have touched on this before, but why not attribute the “surprisingly” strong growth to the Fed’s policies? What would be wrong with arguing that the U.S. experience in 2013 is a sign that monetary policy is effective even when nominal interest rates are at the lower bound?
The differences in monetary policy in recent years also seems to be part of the explanation for the differences in the US and euro economies in recent years.
Ricardo, brilliant. Thank you and thank your friend for his/her clarity in succinctly stating the obvious that obviously cannot be admitted by establishment economists.
The focus on public debt by many academics creates a political debate that obscures the structural drag effects of demographics, “globalization”/”trade” (neo-imperial “trade” regime), PRIVATE debt to wages and GDP, and the resulting end of the reflationary effects on the growth of economic activity when the cumulative imputed compounding interest claims of private debt on wages and GDP are so large as to no longer permit growth of private economic activity.
Neither supply-side nor Keynesian policies can resolve the secular Long Wave debt cycle we currently face after 32 years of falling nominal interest rates and the reflationary effects from increasing debt to wages and GDP. More private debt (debt-money lending/deposits) to wages and GDP to increase supply does not work when there is too much private debt to service.
(Total rentier income [interest, dividends, and capital gains)] received disproportionately by the top 0.1-1%, and total gov’t receipts combine for an equivalent of 51% of GDP, 120% of public and private wages, and 145% of private wages. The hyper-financialized economy and local, state, and federal gov’t spending at 35% of GDP is resulting in a private sector so burdened by debt service, i.e., “rentier taxes”, and gov’t taxation that it cannot grow.)
Nor is more public debt to wages and GDP successful in increasing gov’t spending to encourage private sector growth when the private sector is burdened with unprecedented debt.
By definition, secular highs in debt to GDP coincide with bubbly asset values to GDP, which in turn is reflected by extreme wealth and income concentration, as the top 1-10% receive 20-50% of income and hold 40-85% of all financial wealth.
The secular debt constraint to real GDP per capita precludes further supply-side expansion of debt, whereas extreme wealth and income concentration and runaway central bank reserve expansion causes asset bubbles, further hoarding at no velocity by the top 1-10%, and plunging money multiplier and velocity.
Historically, high debt/GDP, asset bubbles, and extreme wealth and income concentration are unambiguous indications of sub-optimal incentives, gross price distortions, misallocation of flows, and precursor conditions to decelerating real GDP per capita, financial panics, currency crises, structurally high labor underutilization, social instability, political reaction, and war.
Then add the structural (“permanent”?) drag effects from peak Boomer demographics AND Peak Oil (and net energy per capita), and the effects of debt and inequality are exacerbated (reinforced).
The median household income per capita for the bottom 80-90% of US households is equivalent today to the country GDP per capita in eastern Europe and the wealthier areas of Central and South America. The bottom 50-60% now have household income per capita of Mexico, poorer South and Central Americans, and South Africa.
The typical American male under age 35 receives an income of 60% of that of his generational predecessor in 1970-73 after taxes, inflation, and the effects of higher costs to income for energy, housing, education, and medical services.
The typical college grad today (the 50% who are employed or not underemployed or unemployable) receives a salary similarly adjusted at the equivalent purchasing power of the minimum wage in 1970.
We should thus not be surprised why Millennials are staying home, or moving back in, with Mom and Dad (or Mom or Dad); why household formation is collapsing; why Millennials’ headship rate is at a record low; why Millennials are not marrying; and why the birth rate for Caucasian females is converging with that of Europeans, Japanese, Singaporeans, and Taiwanese.
In spite of all of this, or because of it, the stock market is melting up and the top 0.1-1% have virtually disengaged from what remains of the productive sectors of the economy on which the rest of us depend for paid employment and purchasing power.
Now the owners of most of the financial wealth and the means of production of goods and services and the managerial caste that facilitates economic activity intend to accelerate automation of paid employment, expand “trade” via an Asian NAFTA, increase immigration to the US, further increase surveillance-state capabilities, and impose “austerity” on the 50% “takers”.
In the context of such conditions, it’s no wonder economists spend most of their time focused on attempting to determine how many angels can dance on the head of the proverbial pin. No one gets paid nor receives tenure, a department endowment fund, and a pension by looking out of the window of the ivy-covered tower at the real world and telling his peers to do the same and write about it.
Matt R.: I didn’t use the word “surprisingly” in my post, but in any event I am happy to accord partial credit to the Fed. The differential between the US and Europe, is certainly partly attributable to the Fed, as well as more expansionary fiscal policy in the US, and the absence of sovereign debt crises in the US.
Menzie:
I apologize for the mistake and didn’t mean anything by it. I should be more careful, before I post comments.
Merry solstice and happy new year!
Tight fiscal policy and loose monetary policy: not a bad combination.
That said, the US central bank should dump the employment target.
Menzie,
Kuhn focused on the populism of fads overwhelming rational thought such as Keynes’ political populist return to mercantilism overwhelming the reason of free market economics.
There is no hope for the medium or long term. Demographics, debt, and liabilities will crush us. Eventually they will be cut, and the resulting political and social chaos will not be beneficial for growth.
Anonymous: And don’t forget Darth Vader and the Death Star are a’coming!