The output gap remains large, even as the external sector supports growth; this outcome is partly due to excessively rapid fiscal consolidation
Economic Slack, Now and Next Year
The CBO released Budget and Economic Outlook on Tuesday. As part of the report, the CBO released its estimates of potential GDP in a manner consistent with the new GDP measures that incorporate intellectual property in the investment data. The output gap remains large and negative, using these updated estimates.
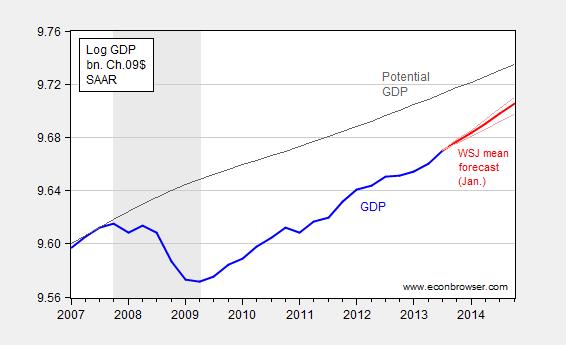
Figure 1: Log GDP (blue), mean forecast from January WSJ survey (red), and high and low forecasts from 20% trimmed sample (pink), and potential GDP (dark gray), all in billion of Ch.2009$, SAAR. NBER defined recession dates shaded gray. Source: BEA 2013Q4 advance release, CBO Budget and Economic Outlook (February 2014), Wall Street Journal January survey, NBER and author’s calculations.
Note that by 2013Q4, the output gap is -4.3% (log terms), and taking the mean WSJ survey response, the output gap at 2014Q4 is -2.9%. Even with the high estimate of GDP growth (after trimming the sample by 20%), the gap is -2.4% (Joseph Carson/Alliance Bernstein), whereas the low (after trimming) forecast indicates a -3.7% gap (Julia Coronado/BNP Paribas). The CBO projection (under current law, and based on data available as of December 2013 and the 2013Q3 second release) is 3.3%.
Fiscal Policy in Action
Part of the reason the progress in shrinking the output gap slowed in 2013 can be directly attributable to fiscal drag — in other words the prediction that the sequester would slow growth was realized. [1] (When the sequester deal was nearly finalized in April February, Macroeconomic Advisers forecasted 2.6% growth for 2013 , with an sequester plus Fed offset scenario growth of 2.1%; q4/q4 growth turned out to be … 2.7%. [2])[Edits 2/7 8:25AM – MDC] Consider the shrinkage in the cyclically adjusted budget balance (expressed as a share of potential GDP). The adjusted deficit shrank substantially in Fiscal Year 2013.
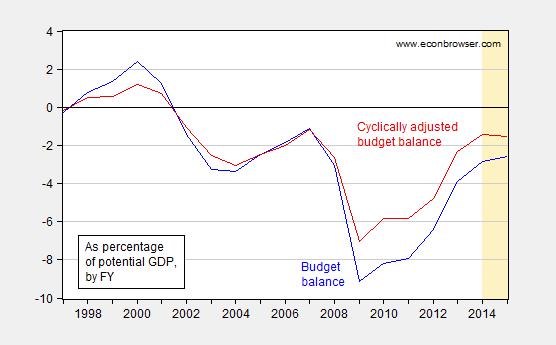
Figure 2: Budget balance (blue) and cyclically adjusted budget balance (red), both as a share of potential GDP, in percentage points. Tan shaded areas denote forecasts. Source: CBO Budget and Economic Outlook (February 2014).
It’s perhaps easier to see the extent of fiscal consolidation by examining the change in the cyclically adjusted budget balance, as displayed in Figure 3.
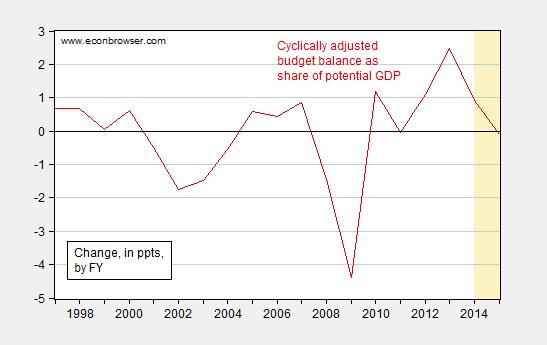
Figure 3: Change in the cyclically adjusted budget balance as a share of potential GDP, in percentage points. Tan shaded areas denote forecasts. Source: CBO Budget and Economic Outlook (February 2014), and author’s calculations.
Notice the adjustment peaks at nearly 2.5 ppts of potential GDP in FY2013, and nearly a percentage point in FY2014. For more on fiscal drag, see [3] [4]
The External Environment
Net exports accounted for 1.33 of the 3.2 ppts of growth in 2013Q4 (SAAR); exports accounted for 1.48 ppts.
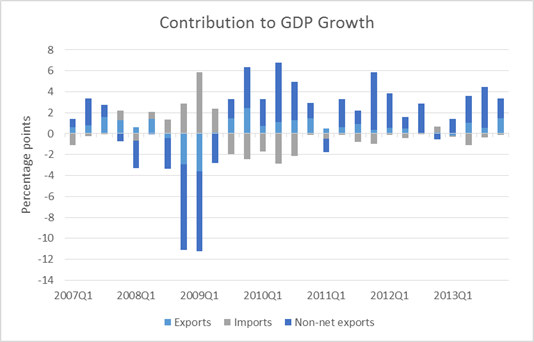
Figure 4: Contributions to real GDP growth from exports (light blue), imports (gray), and consumption, investment and government spending (dark blue). Source: BEA 2013Q4 advance release and author’s calculations.
The advance estimate relies upon forecasts of certain components, including December exports and imports (which will be released Thursday morning). One question is whether support from net exports will continue into the future.
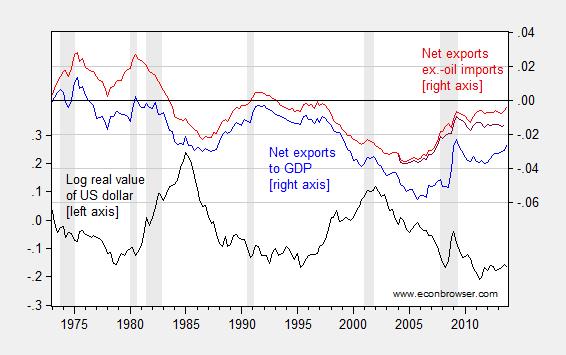
Figure 5: Log real value of US dollar against broad basket of currencies (black, left axis), net exports (blue, right axis), net exports ex.-oil imports (red), and net exports ex.-oil products (dark red), as a share of GDP. NBER defined recession dates shaded gray. Source: Federal Reserve via FRED, BEA 2013Q4 advance release, BEA/Census, NBER, and author’s calculations.
In other words, there has been substantial improvement in the trade balance. Exports in particular have surged in the past couple quarters, despite the relative stability of the US dollar, in inflation adjusted terms.
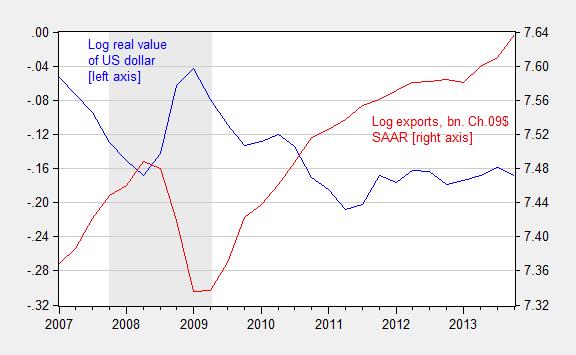
Figure 6: Log real value of US dollar against broad basket of currencies (blue, left axis), and log exports of goods and services, in billions of Ch.09$ SAAR (red, right axis). NBER defined recession dates shaded gray. Source: Federal Reserve via FRED, BEA 2013Q4 advance release, and NBER.
It remains to be seen whether export growth will continue at this pace given the turmoil in emerging markets and the tentative nature of the recovery in Europe. In particular, depreciating emerging market currencies [5] could result in a stronger dollar — the daily nominal index has recently exceeded levels in early July and in August. For its part, CBO projects a relatively stable dollar in 2014, while Deutsche Bank forecasts a twelve-month 8% appreciation (from 12/18).
Update, noon 2/6: December trade figures released today indicated a $38.7 billion trade deficit, slightly larger than the Bloomberg consensus of $36 billion. Jim Dorsey at IHS-Global Insight as well as Macroeconomic Advisers estimate that 2013Q4 growth will be 0.4 ppts lower (q/q SAAR) as a consequence of these figures.
Nominal exports are shown in Figure 7 below.
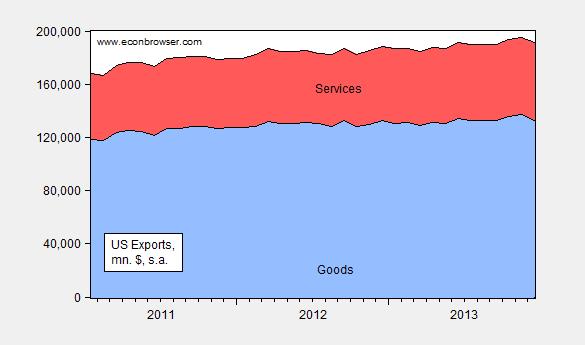
Figure 7: Nominal exports of services (blue) and services (red), in millions of dollars, per month, seasonally adjusted. Source: BEA/Census.
Most people do not dispute that GDP would be stronger if the government spent more money. We do dispute that the benefit of doing this, spending who knows how many trillions of dollars to artificially expand the government by an unknown amount, outweighs the cost of spending all of that money. This is why, on average, conservatives say that the government should be as small as possible: The benefit received from a huge government is not matched by the cost of paying for that same large government.
Anonymous,
spending who knows how many trillions of dollars
Well, you might not know, but I think most people who follow these things have a pretty good idea how much stimulus the economy actually needed.
artificially expand the government
Good thing you included the adverb “artificially.” Now, can you explain the difference between “artificial” and…what?…”natural”?…”organic”?…expansion of the government? And what happens when cyclical spending contracts after the economy recovers? Is that an “artificial” contraction of government? Would you oppose that too because it’s “artificial”?
outweighs the cost of spending all of that money.
I see. So you’ve actually sat down and calculated all these costs. Good for you. Now show us your calculations. Let me rephrase what you wrote to better capture what I think you really meant to say: “Since I personally am not adversely effected by the recession, any dollar spent to spur job growth for others is a dollar out of my pocket. And since I’m the most important person in the world, that obviously means the costs of fiscal stimulus outweigh the benefits.” Do I have that right?
on average, conservatives say that the government should be as small as possible:
I’ve never actually heard a conservative make that argument. What I tend to hear are arguments for lots of smaller sized units of government, but that’s not the same as arguing for less government. If they really wanted less total government, then they would rally behind Alexander Hamilton’s first recommendation to the Constitutional Convention that the thirteen states should be abolished and replaced with a single national government. Go check the NIPA tables. State and local governments consume more per capita GDP than the federal government. And if you want to talk about governments that stick their noses into everyone’s business, you don’t have to look much further than state and local governments. So until conservatives start talking about abolishing the states, then I’m afraid I can’t quite buy their disingenuous claims about wanting smaller government. Smaller governments (plural), yes. Smaller government per se, no.
The benefit received from a huge government is not matched by the cost of paying for that same large government.
Again, you seem to be viewing things from how fiscal policy affects you and you alone. Look at Menzie’s chart. See that big triangular-ish gap between potential GDP and actual GDP? That’s income that is lost forever. Forever. With the Wicksellian clearing interest rate still in negative territory, any government spending would generate benefits sufficient to overcome the costs.
Here’s what I got out of your post. You can’t really refute Menzie’s point that the recession has cost us a lot. And you can’t really refute Menzie’s chart showing a continuing output gap. So you say the words that “[m]ost people do not dispute that GDP would be stronger if the government spent more money,” but then you immediately go about forgetting what you just said and claim without evidence that government spending is not worth the costs. This my friend is a very confused argument.
Gov does not spend to gov but to owners and citizens (recycling money and, no YOU wont get any), not that Mitt and the boys need another boat. Maybe a weekend orbiting in the new space buggy huh?
In 2009, Obama promised his policies would create 2 to 3 million jobs by the end of 2010. Who would have known at the time that what he actually meant is that his policies would cause 2.3 million job losses by 2021. Raise health insurance premiums on Paul to subsidize Peter’s health insurance so that Peter can retire. And it’s GOOD economics too — it’s liberating! Welcome to Obama’s world.
anon and really lazy,
actually krugman already posted on this issue from this weeks CBO report, and your statement is factually incorrect. The report indicates a reduction in labor working by that amount, not lost jobs. If i really only want to work 20 hours a week, but i need a full time job to obtain my employment based benefit of health insurance-then i work the additional 20 hours a week. individual policies were not available to me at the time. now i can reduce my hours to the desired 20 hours a week, buy my own equivalent and affordable health insurance, and have an additional 20 hours a week to do as i please. this is NOT a lost job-just more efficient use of my resource-time. tying health insurance to a full time job can be a very inefficient use of one’s resources. get rid of that market failure!
You choosing not to work may be efficient for you, but it is not efficient for those who are forced to subsidize your decision to become a liberal slackard. Work less all you want, but pay for the the consequences of your decision yourself.
the problem was i could not fairly pay the consequences of my decision in the previous world of health insurance. it was extremely difficulty for a person to obtain affordable and comprehensive health insurance on the individual market, insurance that was comparable to large group insurance. that is a huge market failure, being corrected by obamacare. why should my ability to obtain good insurance be directly tied to me working for somebody else? if i want to open a small business and take advantage of my own skill set, in the past this was difficult because of a paucity of reasonable insurance options. no longer the case. why not support those who want to most efficiently utilize their best resources? why keep an entrepreneurial spirit tied down to a large corporate interest? that was the reality of the previous world.
your “liberal slackard” comment indicates an ignorance and contempt for those who would like to in essence follow the dream of small business ownership. you would prefer folks remain pawns to the large corporations? is your motto “the beatings will continue until morale improves”?
The CBO confirms those numbers. At the low end, 1.2 million jobs were created by the end of 2010. The high end estimates are 6 million jobs. The average of the low and high estimates is 3.6 million jobs (Table 1).
http://www.cbo.gov/sites/default/files/cbofiles/attachments/ARRA_One-Col_0.pdf
As others pointed out, since you are indeed lazy, is that there is no destruction of 2.3 jobs. In fact, the CBO claimed the opposite; the ACA will increase the demand for jobs.
Your rather live in a disinformation bubble and express it with fake rage. You are upset by the fact that some people may choose to work less since under the old system the incentives were distorted to make people work more. Now people are not as trapped to work in a job they do not like simply for the benefits. They have a greater freedom between jobs, spending more time with family, and the ability to retire early. This is indeed a good thing and should be celebrated as we progress as a society.
You, on the other hand, in your fake rage think this is a bad thing. According to your logic, programs like Social Security, Medicare, 40-hour work week, and child labor laws are atrocious policies since they reduce the supply of labor. America would be better off without safety nets, going back to a 60-hour work week, and putting children back into factories.
There is a valid argument though – the ACA does give some people the incentive not increase their work or income since the subsidies are set up in a way that it would be a marginal tax. However, the solution would be to increase the subsidies or implement a single payer system, neither supported by the ACA opponents. Instead, they rather just fake rage and live in disinformation bubble.
floydd,
Miitt got rich saving failing companies (ironcially even his own parent company). Tell me again how Obama got rich?
Ricardo—Obama got rich by having Bill Ayers write a book for him.
Obamacare; it’s both, a floor wax AND a dessert topping!
The effects on economic growth is the same whether money is spend by “we the people” on stuff and services for “we people” or the money is spend by individual people on stuff and services for that individual. I have yet to see anybody make a coherent argument for why it matters what entity is spending the money that goes into the GDP formula. Yes you can argue that when individuals purchase stupid Chinese made trinkets it is less stimulating for the economy than when government build roads and bridges. However, if you compare apples to apples there is no difference in the economic growth effect of a specific type of spending just because it was done by a collective group of people (government) rather than by an individual. When individuals for whatever reason fail to increase their spending so we can get that positive self-reinforcing loop of spending and growth going, then government has to prime the pump and increase it’s spending so that jobs can be created and people getting those jobs can increase their spending which will create even more jobs etc, etc,. The size of that government stimulus will determine how long it takes for the economy to get back to full capacity. China instituted a stimulus as big as the projected loss of aggregate demand in 2009 and never entered a recession. US instituted a $0.8 trillion stimulus when faced with a $2.0 trillion fall in aggregate demand, and as expected did stop the free fall but have not yet recovered fullback to potential GDP.
DaDude: So, if the government hires 100 workers and spends an additional $500,000 of taxpayer’s money having ‘workers’ dig a hole and another $500,000 of taxpayer’s money having them fill the hole back in, the effects on economic GROWTH would be the same as if I spent $500,000 of my own money to build a new factory and then hire 100 individuals (at $500,000) to work the plant producing something that has economic value. Right! Sadly,yours is the same old tired school of economics subscribed to by Obama (except that Obama doles the $1 million out to political cronies), the school that has given us this wonderful recovery……
We’re in a recession: that means that, in fact, private investors are *not* stepping up and building factories. *Everyone* agrees that it would be nice if they were.
We’re in recession!! I thought the recession ended in June of 2009, but then maybe the NBER has it all wrong. What we are in is a meager recovery…..thanks in large part to the economic policies–more spending, more taxes, more regulation, Obamacare–and constant class warfare of this administration, policies that have amounted to a war on productive elements of society.
Sure, “meager recovery” is the right phrase.
As far as the rest goes, I’m puzzled: do you really think that only .1% of the population is productive? And, you seem to identify with them – are you that wealthy?
anon and lazy,
and your response to the recession would have been cut back even further on safety nets and allow survival of the fittest you dirty animals! in other words, you believe in expansionary austerity!
i didn’t see any private individuals building a new factory in the middle of the recession. show me how that is accomplished in a demand challenged economy?
your post is baffling, baffling BS
anon and lazy,
the baffling, although sad, part is that it accurately describes the world view of the expansionary austerians. somehow if all sectors of an economy and government cut back, we will see miraculous growth! i know you don’t like this thrown in your face, but at its essence that is the belief! baffling!
you cry a couple of comments back about class warfare. look at the data that shows who has and has not benefited from the growing wealth in the past 30 years. there is one cohort of folks who have benefited. everybody else is level or dropping. so you tell me who is conducting class warfare? if ever larger wealth is going to the top and not the bottom, what would you define that as? and it certainly has not helped the prospects for those at the bottom!
I think you’re confusing “productive capacity” with GDP. If the government pays people to dig holes, that puts money in circulation: those ditch diggers will immediately turn around and spend their money, buying the output of existing factories, factories which at the moment are underutilized. Those factories will immediately put people to work, making more stuff, replenishing inventory, etc.
But, if the economy is running below capacity, then it’s counterproductive for unnecessary new factories to be built. The chairman of Toyota said yesterday that part of the secret of their record profits was not building unneeded factories.
Actually, a firm that borrows money from a bank to invest to create a production facility that hires and trains employees and a Government that sells a bonds to a bank to build infrastructure and hires workers to produce services is getting “money” created for it by the bank. Now the Government, because it has the power to tax and the monopoly on legal coercion to enforce that power, can guarantee to the bank that it is more likely to pay off the bond then the firm, which has to be able to manuver and negotiate its way in a private market to sustain sales sufficient to pay off the loan, hence the lower interest rate on Government bonds. But in both cases it is the future revenues that pay off both loans, not current immediate revenues. And economic growth, higher per capita income, and a modest inflation makes the paying off the loans possible without raising taxes per capita as long as the debt grows less than the rate of economic and population growth and plus the rate of inflation. Hence the stupidity of current policy of engaging in austerity, and risking deflation, when interest rates are at the lowest since the 1930s (actually, they may lowest in recorded history over so many nations for such a sustained time) while the U.S., Europe, and Japan have such huge output gaps and the world is being flooded with production and labor as the populations of China, India, Southeast Asia, Latin America, and finally Africa transition into the Industrial revolution.
anon and lazy,
If your company hire 100 workers to make moronic stupid little plastic trinkets that break before they can leave the factory so they get buried in a hole behind it, it is the exact same economic effects as the classic Keynes “government digging and filling holes”.
You have to compare apples to apples and hold all other parameters equal. So the equivalent of the famous government digging and filling a hole is a completely useless private sector activity that produce no other economic activity than giving the labor an income which will be spend and increase velocity of mony.
Your presumption is that government will use the money on something unproductive whereas the private sectors products have “economic value”. That is a tired old right wing presumption that has no connection to the real world. Clean water, unpoisoned food, and modern infrastructure has a much greater “economic value” than stupid little disposable trinkets made in China. So yes you can cherry-pick items from each sector to “demonstrate” higher “economic value” on whatever side you want. But if you want to be taker serious you have to compare apples to apples – and then there is no difference in whether the spending is individual or “collective” – its all spending. From an economic growth point of view it makes no difference if we indulge ourselves with some stupid disposable private sector produced item, or the public sector waste a similar amount of money on a useless activity that required the exact same amount of American labor hours.
“If your company hire 100 workers to make moronic stupid little plastic trinkets that break before they can leave the factory so they get buried in a hole behind it, it is the exact same economic effects as the classic Keynes “government digging and filling holes”.”
You’re right–it would the same effect and would be a massive waste with no effect on economic growth. Fortunately, those in the private sector, when spending their OWN money, are not this stupid. It’s takes government to throw $1 million down the rat hole … and do it time and time and time again…..
Go to the nearest dump and you will see thousands of stupid little (private sector produced) plastic trinkets, broken and thrown away. Talk about millions thrown down the rat hole. Complete and total waste except for the jobs and income provided for the workers making them.
Peak is from a bubble economy, 2007, this is nonsense. This was by all folks considered an overheated economy. Peak should be far below this. Dean Baker makes the same mistake, equating 2007 with some equilibrium, or optimal output. Krugman too. 2007 = golden age is inconsistent with 2007=bubble. I remember studying order statistics, like maximums and so forth, very differernt than normal assumptions.
<a href="http://www.nationalreview.com/corner/370546/few-more-thoughts-cbo-report-yuval-levin#!A Few More Thoughts on the CBO Report
Excerpt:
ricardo, as noted above this is NOT job loss, but decision by labor to do other things with their time. on one hand, you could argue employers are not paying enough for labor to provide their services. on the other hand, this also opens up opportunity for those without a job to obtain a job-since somebody else is passing up on work hours.
the gripe from some folks boils down to the fact this scenario appears to slide the advantage away from employers and towards labor.
All these low wage workers who increase their leisure by choosing (at the expense of someone else) to work less will see their income decline. This will increase income inequality …… but not to worry, it’s an efficient rise in inequality. Why work when you can vote Democrat.
what about the older folks who would like to phase into retirement? ah the 63 year old deadbeat grandma who can now work part time at walmart and baby sit her grandkids a couple of days a week, and still have health insurance.
anon and lazy, why do you have such hatred for fellow citizens who were not born with a silver spoon in their mouth like yourself?
Blah, blah blah…….
anon and lazy, nice response. when wrong simply shout louder than others! unfortunately, that tack still does not change the truth!
No they will hand the work over to someone unemployed who will se a serious increase in income. So the overall effect is lifting some of the lowest income (like in $0 after UE runs out) people up a little and that reduce the GINI coefficient.
anon and lazy,
Income as measured by GDP will shrink as people voluntarily leave the labor force due to ACA. But economists only use GDP (actually NDI) as a proxy for aggregate utility or welfare. The real concern is how ACA affects aggregate utility, which is not directly observable. Forcing people to work more than they would prefer to work in an undistorted market decreases utility. The labor market prior to the ACA was certainly distorted; e.g., tax preferences for employer based health insurance. The ACA introduces another economic distortion, but one that works in the other direction. The net effect is likely to increase aggregate utility overall eve if it reduces GDP (or NDI). If the NIPA tables fail to account for this higher level of aggregate utility, that is simply evidence that the NIPA tables are imperfect proxies for utility. The problem is more with the way we measure utility than it is with the ACA.
You also seem confused about the likely effects of the ACA on low wage workers. The CBO report was pretty clear that the smaller labor force would put upward pressure on wages, so it’s almost certainly good news for low wage workers. And here we get to what I have always suspected was the small business community’s real concern about ACA. I’ve mentioned this a couple of times on this blog. The long run effect of the ACA will be untether workers from existing jobs that provide health insurance because of tax advantages, but workers earn a low marginal revenue product. In other words, the ACA will improve the bargaining position of low wage workers at the expense of small business owners. The basic rule is that the more elastic the labor supply curve is, the stronger labor’s bargaining position. Small businesses don’t really oppose the ACA because of any crazy concern about having to pay for health insurance. Their real concern is that ACA will increase wages because it increases the elasticity of the labor supply curve.
“…Part of the reason the progress in shrinking the output gap slowed in 2013 can be directly attributable to fiscal drag — in other words the prediction that the sequester would slow growth was realized. [1] (When the sequester deal was finalized in April, Macroeconomic Advisers forecasted 2.6% growth for 2013; q4/q4 growth turned out to be … 2.7%…”
But in the February 19 Macroeconomic Advisers forecast which is linked to in this post, the forecast of 2.6% real GDP (RGDP) growth did not include the sequester. The forecast with the sequester was for only 2.0% RGDP growth:
“…•Our baseline forecast, which shows GDP growth of 2.6% in 2013 and 3.3% in 2014, does not include the sequestration.
•The sequestration would reduce our forecast of growth during 2013 by 0.6 percentage point (to 2.0%) but then, assuming investors expect the Federal Open Market Committee (FOMC) to delay raising the federal funds rate, boost growth by 0.1 percentage point (to 3.4%) in 2014…”
http://macroadvisers.blogspot.com/2013/02/mas-alternative-scenario-march-1_19.html#!/2013/02/mas-alternative-scenario-march-1_19.html
Macroeconomic Advisers baseline forecast was that RGDP was to grow by 2.1%, 2.4%, 2.9% and 3.0% at an annual rate in 2013Q1 through 2013Q4 respectively. Their forecast with the sequester was that RGDP would grow 1.6%, 1.1%, 2.3% and 2.9% at an annual rate in 2013Q1 through 2013Q4 respectively. Actual RGDP growth was 1.1%, 2.5%, 4.1% and 3.2% at an annual rate in 2013Q1 through 2013Q4 respectively.
Growth turned out to be worse in 2013Q1 than in either forecast, but better in 2013Q2 through 2013Q4 than in either forecast. Actual year on year 2013Q4 RGDP growth with sequester (2.7%) was higher than Macroeconomic Adviser’s forecast without sequester (2.6%). This is consistent with Scott Sumner’s prediction that year on year RGDP growth in 2013Q4 would be about the same regardless of any fiscal policy changes due to the monetary policy offset of fiscal policy.
Furthermore the sequester was only a small part of the federal fiscal consolidation that took place in 2013. The “sequester” refers to the automatic spending cuts in particular categories of outlays that were initially set to begin on January 1, 2013, as a result of the Budget Control Act (BCA), and were postponed by two months by the American Taxpayer Relief Act of 2012 (ATRA) until March 1. ATRA also addressed the expiration of certain provisions of EGTRRA and JGTRRA (the “Bush Tax Cuts”), the 2-year old cut to payroll taxes (the “Payroll Tax Holiday”) and federal extended unemployment insurance. An increase in income tax rates applicable to high income tax payers, an increase in the payroll tax, and a continuation of federal extended unemployment insurance went into effect on January 1, 2013.
In short, the sequester only refers to the spending cuts that went into effect on March 1, 2013 and does not include the two major tax increases that went into effect on January 1, 2013. Based on the CBO’s November 2012 analysis of the “fiscal cliff”, the tax increases that went into effect were approximately twice as large in terms of their budgetary effect as the sequester.
A careful reading of the CBO’s estimates from November 2012 indicates that the fiscal consolidation (the 2% payroll tax increase, the high income tax increase and the sequester) should have subtracted 1.3% from year on year RGDP growth through 2013Q4. Prior to the beginning of 2013, the CBO’s forecast without any fiscal consolidation was for 2.4% year on year RGDP growth in 2013Q4. Thus the CBO forecast with fiscal consolidation was for 1.1% year on year RGDP growth in 2013Q4.
A similar thing applies to the major private forecasters. The effect of the fiscal consolidation (again, the 2% payroll tax increase, the high income tax increase and the sequester) according to Bank of America, IHS Global Insight, Moody’s, Goldman Sachs, Morgan Stanley, Macroeconomic Advisers and Credit Suisse ranged from 1.0% to 2.0% of GDP, with the average estimate being about 1.6%. The baseline forecast prior to the beginning of 2013 of these same seven private forecasters was for year on year RGDP growth of 2.0% to 3.5% in 2013Q4 with the average forecast being about 2.7%. Thus the average forecasted year on year RGDP growth in 2013Q4 adjusted for fiscal consolidation was about 1.1%.
In short, year on year RGDP growth in 2013Q4 ended up as high, or higher, than what was forecasted without fiscal consolidation.
So it would appear that monetary expansion succeeded in completely offsetting fiscal contraction.
Well put Mark! I’m waiting with bated breath on Menzie’s reply.
Mark A. Sadowski,
How best to handle the effect of the sequester is unclear to me. It didn’t become official until a few months into the calendar year, but government offices (and especially DoD) had been operating under the assumption that the sequester would be in effect for all of fiscal year 2013; i.e., beginning Oct 2012. If you look at NIPA 1.1.1 you will see that government spending collapsed in in CY2012Q4, which is the same as FY2013Q1 (DoD spending down 21.6%). Recall that BEA records things by calendar year, but the government operates according to the fiscal year. Government agencies made a conscious effort to smooth the expected sequester cuts over the entire fiscal year rather than try to absorb them all in the last 2 fiscal quarters. This means that the government spending “glidepath” plans were actually formulated over the summer of 2012…almost 9 months before the sequester formally kicked in. NIPA table 1.1.5 (nominal GDP) clearly shows this. The question is, do you believe private sector actors doing business with the government treated the start of the sequester in CY2013Q2 or FY2013Q1? If the latter, then the effects of the sequester were already baked in the cake by late summer of 2012. I think this is a general problem with “news events” studies in general. For example, in one of her “news events” papers on the multiplier effects of defense spending, Prof. Valerie Ramey uses the example of a large supplement for Vietnam War spending. The “news event” is a 27 Aug 1966 story in Business Week that quoted various blowhard senators on an expected $10B-$15B appropriation (at that time a hell of a lot of money). According to Business Week the exact amount was a “closely guarded” secret in Washington and it was assumed that Senate members were in the know. The problem is that the size of the appropriation was only unknown to readers of Business Week. In fact, it was well known that three days prior to the Business Week story (24 Aug 1966) the SECDEF signed a memo that had been floating around the Building since February 1966 that withdrew that particular request for additional appropriations. It’s hardly a stretch to claim that the existence of this memo withdrawing an appropriation request was hardly a “news event” for those who closely followed defense issues. Defense contractors were well aware of it even if Business Week readers were not. So how do you score a “news event” like that? Did it stimulate business expectations (as Business Week readers would conclude), or did it depress expectations (as readers of defense oriented periodicals would conclude)? I see the same kind of ambiguity with “news events” surround the sequester. If you were a government insider the effect of the sequester was strongest in CY2012Q4. But other actors might look to CY2013Q2 as the threshold date. If you are a forecaster like Macroeconomic Advisors, do you look to the formal timing of the sequester, or do you look to (what were at the time) unobserved effects of the sequester plans having already been implemented in CY2012Q4?
“If you look at NIPA 1.1.1 you will see that government spending collapsed in in CY2012Q4, which is the same as FY2013Q1 (DoD spending down 21.6%). Recall that BEA records things by calendar year, but the government operates according to the fiscal year. Government agencies made a conscious effort to smooth the expected sequester cuts over the entire fiscal year rather than try to absorb them all in the last 2 fiscal quarters. This means that the government spending “glidepath” plans were actually formulated over the summer of 2012…almost 9 months before the sequester formally kicked in. NIPA table 1.1.5 (nominal GDP) clearly shows this.”
But was the big plunge in defense spending in 2012Q4 really that unusual? No, it’s part of a pattern. In recent years defense spending has always dropped a relatively fast pace in the fourth quarter. Yes, real defense gross investment and consumption expenditures fell by 21.6% at an annual rate in 2012Q4, but it also fell by 10.2% in 2011Q4 and by 14.0% in 2013Q4. Why was the decline so much larger in 2012Q4? Well real defense gross investment and consumption expenditures increased by 12.5% in 2012Q3. Compare that to an increase of 2.4% in 2011Q3 and to a decrease of 0.4% in 2013Q3.
So the decrease in 2012Q4 is really a result of the unusual increase the previous quarter. One way to see this is to average the rate of change in real defense gross investment and consumption expenditures across the third and fourth quarters of each year. Real defense spending decreased at an annual rate of 3.9%, 4.6% and 7.2% between the second and fourth quarters of 2011, 2012 and 2013 respectively.
The real question is why did defense spending increase by so much in 2012Q3? Congress was late in setting the defense budget for FY 2012. The budget was finally patched together through continuing resolutions in the winter. So the defense department was unsure exactly how much it could actually spend. That explains why defense spending was relatively anemic earlier in calendar year 2012 and then skyrocketed right before the fiscal year ended in 2012Q3.
There are a couple of problems with your argument. First, if it could be explained by Congressional inaction, then we should have seen the same pattern on the non-defense side. But we don’t. Second, while it is true that there was a large spike prior to the sharp drop, it’s also true that the large spike followed several consecutive quarters of negative growth. And the large 21.6% drop was followed by an 11.2% drop in FY2013Q2, which was before the sequester formally kicked in. My point was that government agencies anticipated the sequester and consciously adjusted spending plans under the assumption that there would be a sequester. I think this makes things a little murky when trying to figure out when the effects of the sequester actually took hold. This makes it tough for Macro Advisors and others to predict the effects of spending cuts if government agencies have already internalized those cuts long before they formally kicked in.
BTW, the spikes found in FYQ3 defense spending is largely a result of the spikes in operating tempos. For example, pilots rack up more flying hours in good summer weather than bad weather, and aviation costs dominate DoD operating tempo costs.
“First, if it could be explained by Congressional inaction, then we should have seen the same pattern on the non-defense side. But we don’t.”
Congressional inaction is most likely to affect (i.e. create a “wiggle” in) real federal gross investment and consumption through two channels: 1) the compensation of civilian employees (defense and nondefense), and 2) the purchase of services by the defense department. Macroeconomic Advisers has a detailed discussion of these issues with respect to the 2013Q4 federal government shutdown here, although it obviously can be interpreted more generally:
http://www.macroadvisers.com/2013/09/showdown-over-a-shutdown-the-gdp-effects-of-a-brief-federal-government-shutdown/
And in fact a surge in defense department services (personnel support, weapons support and installation support) accounts for the entire increase in real defense consumption in 2012Q3:
http://www.bea.gov/iTable/iTableHtml.cfm?reqid=9&step=3&isuri=1&903=109
“Second, while it is true that there was a large spike prior to the sharp drop, it’s also true that the large spike followed several consecutive quarters of negative growth.”
To be specific, it occured after *three* consecutive quarters of negative growth, that is, the first three quarters of FY 2012.
“And the large 21.6% drop was followed by an 11.2% drop in FY2013Q2, which was before the sequester formally kicked in.”
Actually the sequester formally kicked in on March 1, 2013, which was one month *before* the end of the second quarter of FY 2013.
Mark A. Sadowski: Thanks for pointing out the error in timing and conditions re: MA f’cast. I’ve corrected the text. I wanted to use a forecast more contemporaneous with the actual finalizing of the sequester (as in the MA f’cast cited) because (1) the CBO forecast was finalized early in December, and (2) the sequester was pushed away from January by the last minute end-of-2012 deal. Whether this proves the Fed was able to completely offset the fiscal contraction is an interesting question — the residual incorporates shocks plus model errors.
Also, thanks to Kevin Erdmann, we see that the January employment report shows continued improvement;
http://idiosyncraticwhisk.blogspot.com/2014/02/january-employment-pt-2.html
‘This is a strong showing for January. The flow from “Not in Labor Force” to “Employed” came back with a vengeance. The previous decline in that category was odd, but that trend has been eliminated now. … the size of the shift is a pretty clear statement about the pattern we want to see in that series of increasing flows over time.
‘The Employment to Unemployment flow reverted back to the trend, but the trend is still decreasing, and it remains well below the Unemployment to Employment flow.
‘Net shifts were firmly into the Labor Force and into Employment.’
So maybe Menzie should think about a, ‘Never mind.’
https://app.box.com/s/so7cgboezfv5zs7xvcm5
Real wages less household debt service and “health care” expenditures are contracting again yoy.
US bank deposits less bank cash assets/reserve deposits have been contracting yoy since summer 2013. Without growth of loans/debt-money/deposits of at least 2-2.5%, debt-money, asset, price, and nominal GDP deflation occurs.
Despite an addition of over $3 trillion in US and foreign primary dealers’ bank reserves, more than $6 trillion in deficit spending, and $13 trillion added back to equity market cap since 2009 with extreme leverage since 2011, incipient US and global debt and price deflation is occurring, whereas most observers appear to be unaware.
https://app.box.com/s/s2nfmtmwgq5l3zrv479l
The yoy rate of real wages, employment, and private investment implies that the Juglar investment cycle peaked in spring-summer 2013 and the economy was at stall speed in Q4 2013.
“Calamity Janet” will likely get her BIG chance to prove her bank reserve printing bona fides sooner than most anticipate.
bc, i see you are keen to give Janet Yellen a fair chance to run the fed!
baffling, as you must know, the Fed Chair works for the owners of the largest domestic and foreign primary dealer/TBTF banks, and s/he decides very little unilaterally, apart from the color of office wallpaper and curtains and what to have for lunch at the Fed cafeteria.
The TBTF banks direct Fed policy for their purposes, not the converse. If this simple fact were internalized and then repeated as the fallacious meme has been for decades, the proper focus and scrutiny would be on the owners of the TBTF banks, the executives they employ, and the colossal institutionalized theft that persists.
The Fed’s principal job is to run political cover for the TBTF banks’ executives and owners’ license to steal labor product, profits, and gov’t receipts by imposing cumulative compounding interest to average term of outstanding debt that is now equivalent to 100% of private GDP in perpetuity.
Moreover, total annual net interest margin after charge-offs and delinquencies of US banks now exceeds annual growth of nominal GDP.
Also, despite $3 trillion in bank reserves and over $6 trillion in deficit spending, the yoy growth of US loans/deposits/money supply growth less bank cash assets has been contracting since summer 2013, which last occurred in 2009-10 and 1938-42.
This is deflationary, needless to say, as the entire net nominal value-added output of the US economy is pledged to rentier claims, causing the after-tax purchasing power of earned income of the bottom 90%+ of US households to contract yoy.
There can be no net growth of real GDP per capita hereafter with the onerous debt service burden on economic activity imposed by the rentier caste for whom the Fed officials toil tirelessly and so far so successfully. Some economists realize this, of course, but they cannot say so publicly because they are not eager to lose their jobs, McMansions, European luxury vehicles, spouses, children’s private school tuition, tenure, pensions, and reputations.
Economic sophistry pays so much better than truth telling.