Here are some graphs of economic data that illustrate some interesting trends.
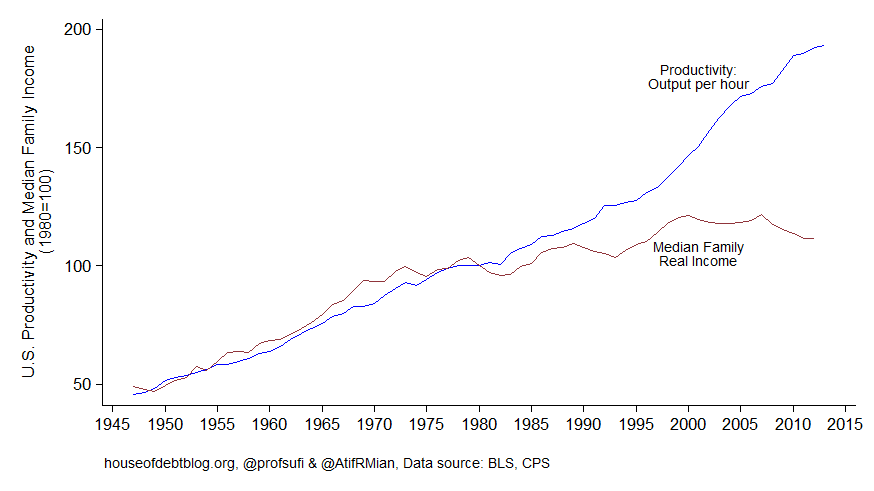
Atif Mian and Amir Sufi note that U.S. median family income grew with productivity in the forty years following World War II but has since fallen behind.
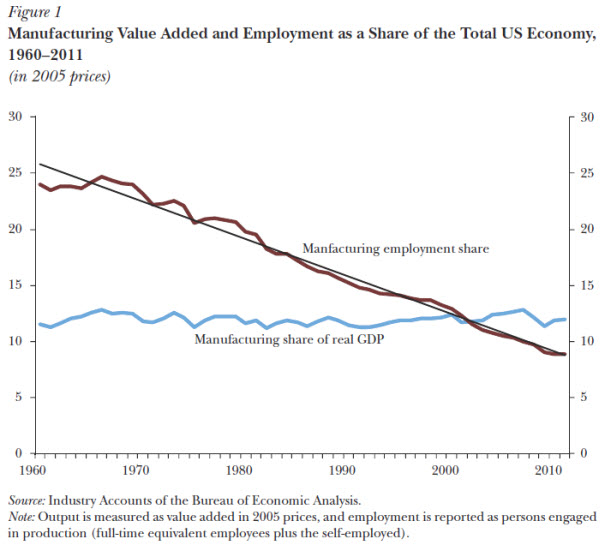
And Martin Neil Baily and Barry Bosworth note that while U.S. manufacturing output has grown at the same pace as the rest of the economy, U.S. manufacturing employment has not.
In terms of monetary policy, the Federal Reserve Bank of Atlanta is now regularly reporting the Wu-Xia shadow fed funds rate. The latest estimate indicates that a return to higher interest rates was farther away than ever as of the end of last month. For a description of what this series tells us, see my discussion here.
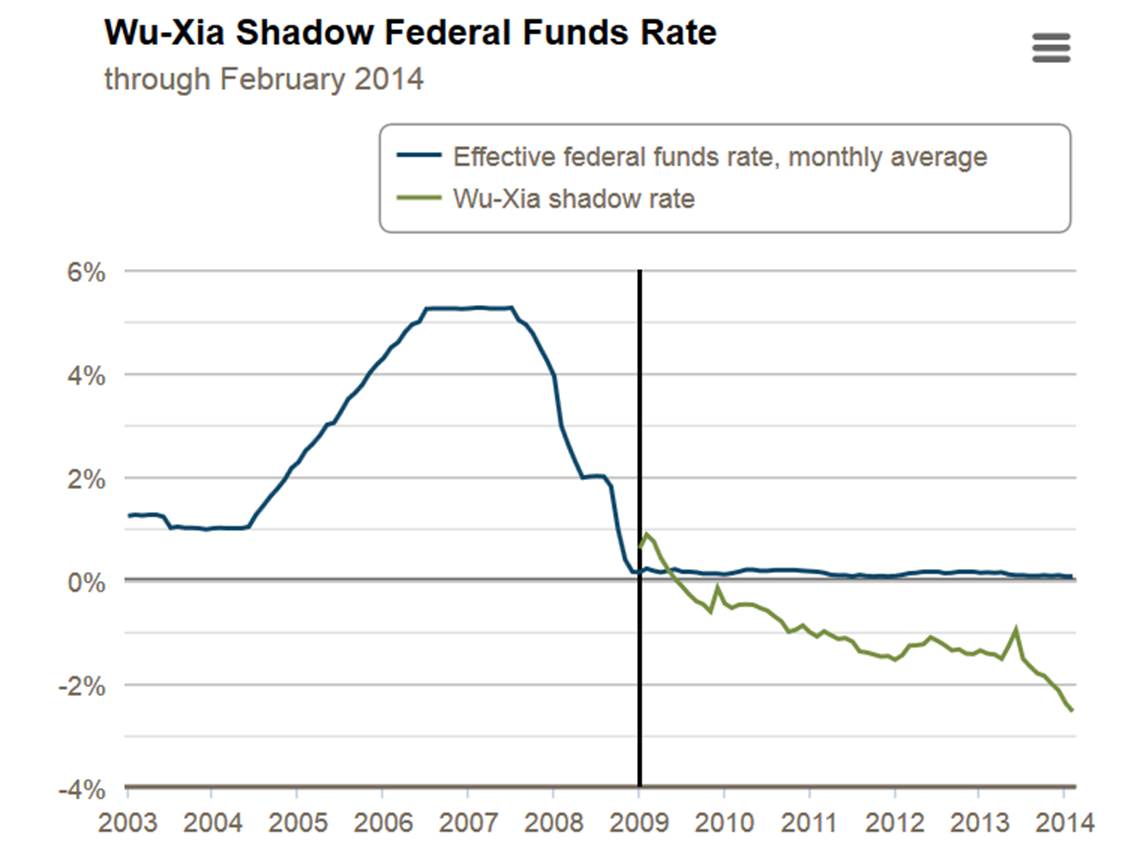
Source: Federal Reserve Bank of Atlanta.
On world oil markets, the Wall Street Journal observes that Iraqi oil production is at its highest level in 30 years.
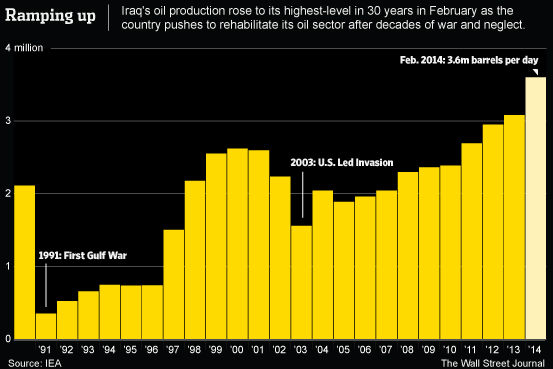
Iraqi oil production in millions of barrels per day. Source: Wall Street Journal.
But Peak Oil Barrel notes that’s more than outweighed by recent turmoil in Libya.

Source: Peak Oil Barrel.
Thanks for all, very interesting stuff.
The Baily-Bosworth figure is misleading if you think of it in terms of the previous one, namely income: the price of mfg is going down as productivity rises. So we’re producing more with less, and also getting less for it. If you look at mfg’s nominal share of value-added, it’s falling throughout the period. See here:
http://pages.stern.nyu.edu/~dbackus/2303/slides_intro_f13.pdf
Or from the BEA, see GDP by industry:
http://www.bea.gov/iTable/iTableHtml.cfm?reqid=51&step=51&isuri=1&5101=1&5102=5&5113=22r&5111=1997&5112=1
The presentation’s fine as it goes, Dave. But a Steelers fan? New England, surely. Baltimore, possibly. But Steelers? That’s a significant personality defect, guy.
The Steelers had a terrible year, certainly the first half. That’s a tremendous organization, but what a bad year. As for New England. Oh gees, we’ll have to recruit widows and orphans again this year. I think we’ll get stuck behind Denver again this year, and no one in the AFC is going to make it past SF or Seattle. But I can tell you this, New England would have lost more gracefully to Seattle in the Super Bowl.
I’d also add that Pittsburgh will be back. Pittsburgh, Baltimore. You can never count them out.
Indeed. Real value added growth reflects the combined effects of growth in labor input, capital services, and multifactor productivity (MFP). Labor input has obviously declined steadily for some time. Capital services from equipment, structures, and software have more than held their own. At least since 1987, though, MFP has accounted for about half of manufacturing real value added growth, and substantially more in recent periods. This leads to declines in output prices.
It is important to note, however, as Bosworth and Baily point out in their article, that nearly all of the credit for manufacturing holding its own relative to GDP is due to computers and electronic components, a category that accounts for only about 10 per cent of manufacturing nominal value added. The remaining 90 percent of manufacturing had an average annual real growth rate of 0.6 percent.
Immigration has been pretty substantial as well, putting downward pressure on wages (or retarding upward pressure, however you want it). Look at construction trades for instance.
Do productivity measurements factor in people being low-balled on wage income?
May I suggest a close reading of a recent post by Michael Pettis: http://blog.mpettis.com/2014/03/economic-consequences-of-income-inequality/
Interesting. Basically shows that manufacturing output has been separated from human labor. That’s not necessarily a bad thing. If we were stuck with 1990 ratios, think how many floppy disks it would take to store all of your files… or even old CDs if you wanted to be cutting edge. What it does is break an old relationship between labor and management, especially unions. Workers have to be more trained and highly skilled. Flopping a piece of sheet metal into a press is not enough anymore. At least not if you want to earn $25+ per hour.
Perhaps that is why the aggregated median income has flattened out. People have not recognized the reality that pursuing manufacturing employment is increasingly difficult and demanding of both academic and vocational skills. The service sector jobs to which the semi-skilled are migrating offers fewer opportunities… even at $10 per hour minimum wage.
Peak Oil Barrel. I was not familiar with this source. Have I met Ron Patterson? Not sure. (Apologies if I have.)
In any event, Ron reviews my Columbia speech here: http://peakoilbarrel.com/can-depend-call-opec-opec-peaked/
The review notes that I ‘ridiculed the IEA’s often used term a “Call on OPEC“’. This requires clarification.
In a demand-constrained model, the call on OPEC is, in fact, an important concept. In such a model, supply and oil prices ultimately depend upon the intentions of OPEC, which acts as the “swing producer”, increasing or decreasing production as necessary to stabilize the market (as OPEC sees it). Therefore, understanding the “call on OPEC” if in fact quite important, and something analysts should and do spend considerable effort on.
In a supply-constrained market, by contrast, OPEC can only choose volumes, not prices. Thus, prices will tend to revert to the carrying capacity price no matter whether supply is added or withdrawn, at least within reasonable margins. This notion gains considerable support from oil price volatility data, which shows Brent price volatility at historical lows by a significant margin. Prices are tending to revert to a central value, with little variance around it. In such a model, the residual is not the call on OPEC, but rather, GDP growth.
Now, I take issue with the “call on OPEC” as an attitudinal matter. It somehow conveys the sense that OPEC is subordinating its own interests to that of the global community, that King Abdullah is waiting by his phone for a call from Washington. I personally find this insulting. For example, suppose we were to use the notion of, say, “a call on GM” for car production, whereby GM would wait until all the other manufacturers had produced as much as they wanted, and then GM would produce the residual. I doubt either GM or the US public would consider this an acceptable state of affairs. However, OPEC is supposed to.
I instead would see Saudi Arabia and other OPEC producers as sovereign entities producing at levels consistent with their own internal priorities. If Saudi Arabia wants to stabilize oil markets, that’s their prerogative. But it’s not their obligation. It’s a favor to the rest of us, and we might want to keep that in mind.
In such a model, the residual is not the call on OPEC, but rather, GDP growth.
I think of “residual” as the difference between a model’s forecast, and the actual. Is that what you mean?
If you mean that oil prices limit GDP growth, which in turn limit oil prices, I’d be curious to see evidence. After all, a lot of commodities show peaks in pricing just before recessions (e.g., copper), but no one claims that copper controls the economy. Please note that the history of association of oil shocks and recessions doesn’t count – we need evidence of this existence in the *long-term*, not for short term oil shocks. For instance, James Hamilton’s analysis of oil shocks focuses on reductions in consumer capex on vehicles – this is a short term effect of Fear, Undertainty and Doubt. For another, the St Louis Fed did some analysis showing that the impact of oil shocks is short-term – I’ll dig it up for you, if that would help.
If Saudi Arabia wants to stabilize oil markets, that’s their prerogative. But it’s not their obligation. It’s a favor to the rest of us
That seems unrealistic. The kindest view is that it’s enlightened self-interest: price stability will help prevent defection of customers to alternatives (the power of which the Saudi’s are very, very aware). A less kind view is that it’s maximizing total revenue by maintaining price per barrel. Even less kind is the view that it’s a quid pro quo for military protection of an illegitimate family dictatorship.
Nick –
The residual is what balances the model. You could call it the balancing factor. I’m not hung up on vocabulary.
If you’re an analyst making (traditional) demand-constrained forecast, then your supply and oil price forecast ultimately depends on the actions of OPEC. So that’s how you’re balancing your model. I call that the residual, what’s left at the end. But if you want to call it the balancing factor, that’s fine with me.
You are absolutely correct that the historical literature focuses on oil shocks, not chronic shortages. I am one of the few people dealing with the chronic aspects of shortages. And I have written a great deal about it, both here in comments and in various articles. For example, I have repeatedly noted that during periods of price elasticity of demand, any damage to the economy will be done through volumes and not prices, and that the Fed’s models focus only on price effects.
A commodity will only limit growth if i) it is directly linked to a critical aspect of economic performance, and ii) it has few or no near term substitutes. Oil links to VMT, about which Menzie posted recently, and VMT has historically been closely linked to GDP growth. And there is no substitute for oil as a transportation fuel in large quantity today. Copper is not necessarily key in either of those aspects. A lack of copper can slow down the economy a bit, but it’s mostly related to infrastructure. It can be substituted by other metals like steel, aluminum or plastic for piping. There have never been, to the best of my knowledge, coal, gas, copper, gold or iron shocks to the economy. Copper and gold have shown peaky tendencies, but they’re not central to economic growth.
As for “defecting to alternatives”, we are now in the ninth year since the legacy supply peaked out in 2005. What sort of progress have we made to substitutes for oil as a transportation fuel? Pretty minimal, it seems to me.
If Saudi is maximizing revenue per barrel, then there is no meaningful call on OPEC. OPEC is doing it’s own thing independent of the interests of other countries. And that’s entirely legitimate from my perspective. That’s the point I was trying to make.
1. Copper is supposedly a metal with few good substitutes. Here is a paper on “running out of metals”:
http://www.pnas.org/content/early/2013/11/27/1312752110.full.pdf+html
I’m actually not crazy about the paper since they don’t show their work–such a short discussion, for 60+ elements. And since a real discussion/analysis ought to include some intuitions from pricing and the like. And be published somewhere other than PNAS. But it is interesting and will be right up y’all peakers’ ally.
2. I actually agree with you that a lot of the substitution is in the realm of “doing without”. For example, taking the bus instead of driving a POV. I’m sure there also is some substitution (e.g. gas heating versus heating oil). It’s probably a bit hard to disentangle from various factors of demand growth also (Asian urbanization, pop growth, etc.). And of course subsititution has different time frames and barriers to substitution. But even here, the years out oil futures market could be argued to be rational expectations, so even though backwarded, still “high”. But that’s why we pay you Ph.D.s the big bucks. Go enlighten us by factor analysis or…something. 😉
3. I think the issue is not OPEC’s benevolence. We saw in 2008-2009, they took deliberate action to elevate price from 47 (rather than being happy it was back in the band). If they could get decent volumes, and maintain cartel discipline at 200, they would do that. The key question is are they taking actions to control pricing or is it a full out free competition world. I think recent history shows them at least taking action at times. So they are not “gone”. And the peaker/Simmons/crazy meme of Twilight in the Desert and the like, looks pretty silly.
I am one of the few people dealing with the chronic aspects of shortages.
The idea of a depleting natural resource really isn’t new to economics. We do quite well without whale oil.
any damage to the economy will be done through volumes and not prices
You’ve made that argument. I don’t think you’ve proved the case that a decline in volumes is damaging. Let me make two simple counter-arguments:
1) as prices rise, the least valuable uses will be dropped. People will make their driving vacations a little closer to home. People will combine shopping expeditions. Container ships will slow down a little (and reduce fuel consumption by disproportionate amounts, due to the 3rd power law of water vessel fuel consumption. The impact on real economic activity will be minor.
2) as prices rise, people will move to equally good alternatives: more efficient cars, more aerodynamic trucks, rail instead of trucks, etc, etc.
A commodity will only limit growth if i) it is directly linked to a critical aspect of economic performance…
The word “linked” is badly ambiguous. Do you mean “correlated”, or “necessary”?
Oil links to VMT
It’s correlated, sure, but oil’s not necessary to VMT. Nor is VMT *necessary* to GDP. Heck, carpooling could provide most the “balancing factor” necessary in the short term, and electric vehicles will do it in the long term.
there is no substitute for oil as a transportation fuel in large quantity today
That’s true only if you focus only on biofuels, or if you require a substitute that can be ramped up overnight. Hybrid electric vehicles reduce fuel consumption by 50%, or reduce overall cost as well. Extended Range EVs can reduce it by 90% while providing equivalent range. EVs can eliminate 100%.
Copper is not necessarily key in either of those aspects.
Exactly: it’s correlated, but not necessary. As is oil, in a very slightly longer timeframe.
What sort of progress have we made to substitutes for oil as a transportation fuel?
An enormous amount: every major car maker is now producing hybrids, EVs and plug-ins. It takes a period of several years to develop such vehicles. Now, of course, we have to educate consumers of their value, all the while battling misinformation from Fox News, et al.
OPEC is doing it’s own thing independent of the interests of other countries. And that’s entirely legitimate from my perspective.
Well, Saudi Arabia isn’t very sovereign: it’s highly dependent on the US, and it’s an illegitimate dictatorship which badly serves it’s own people, and damages the rest of the world by subsidizing a reactionary religious sect in order to distract from it’s illegitimacy. It has drawn the US into several very, very expensive wars.
Most importantly, they want to keep their customers hooked on a commodity which has outlived it’s usefulness.
Here you go, Nick. Nice article from CNBC about how Americans can no longer afford new cars.
“And 80 percent of “Generation Y,” those born 1977-1994, who have no plans to buy or lease a car say they can’t afford it.”
http://www.cnbc.com/id/101522551
Steven,
I don’t see anything new in this article. Average Americans have *always* been unable to afford new cars: that’s why used car sales have historically outnumbered new car sales by 3:1, and why the average car on the road historically has been very roughly 9 years old (or 6 years old weighted by VMT, which is skewed to new cars ).
Personally, I can afford to buy a new car, but I don’t see the value – I buy 7 year old cars for 40% of the price.
Why don’t you just call it a cartel controlled price or a free competition price? You don’t need to invent these terms “demand constrained” and “supply constrained”.
The first year micro econ book has very good insights here. How pricing falls out in free competition, in monopolist profit maximizing, in various scenarios of changes to the demand or cost curves.
We are on a blog run by econ professors. Cf. Mansfield’s Managerial Economics. Even Wikipedia has a surprisingly sound discussion.
In 2008-2009, there WAS definite cartel action to raise prices. No way, those producers drop production like that in a normal free competition market.
See first chart, here.
http://peakoilbarrel.com/opec-update/
While the blog post was constructed to show that OPEC is irrelevant and depletion the thing that drives prices, it really supports an opposite interpretation. That 2008-2009 deliberate cutback after prices fell to 47 was clear, clear market action. OPEC not a paper tiger.
OPEC moved to support prices in late 2008 and early 2009.
The marginal cost of an incremental barrel was around $70 then, and the price had fallen to $30-40 dollars. OPEC cut production to raise prices back to around the global replacement cost level.
I would add that OPEC members are subject to quotas even now. Personally, I don’t think production would be much higher even if all restraints were removed. We’re certainly not hearing any complaints about producers cheating on their quotas.
Did you actually read Ron’s article, Nick?
I’m not Nick, but I think you are talking to me. Yeah, I read the article. And I got different insights from what Ron was pushing. He serves to tee up the discussion even when he’s wrong. I really valued his charts. It’s just that paradoxically it supported opposite POV! I had not known about the 2008-2009 OPEC shorting. And when I saw that DRAMATIC volume cutback and then the clear change of 47 back to 100, it sent shivers through me.
Remember what Rockefeller told other producers: “Remember we are not each others enemy. The real enemy is the CUSTOMER.”
Well, I recognize that. And I want to get my enemies fighting amongst each other (price taking) so that I benefit, rather than conspiring against me (cartel).
More evidence of OPEC being the price controllers.
http://gulfnews.com/business/opinion/time-nigh-for-opec-to-adjust-production-levels-1.1307518
Nony –
I avoid the use of the term “cartel price” for three reasons.
First, the market comprises players of differing motivations. For example, Shell or Continental Resources are profit-maximizing price-takers, and they have been running full out. They are not restricting production, something which would be required of a cartel. By contrast, the Saudis are revenue satisficers, that is, they produce the oil needed to meet national budgetary requirements. Unlike Shell, which will try to produce as much as quickly and as profitably as it can, the Saudis and other national producers will tend to take a longer view, although they will try to maximize price per barrel ordinarily. This does not necessarily imply cartel-like behavior, but it could. Finally, we have a number of NOCs which are simply poorly run. Pemex, YPF and many others fall into this category. They are neither profit-maximizers, nor long-term revenue maximizers. They are simply mismanaged due to local conditions. To speak of a cartel therefore over-simplifies the situation on the ground and suggests collusion when in fact none exists.
Second, in a supply-constrained model, the Saudis can only choose volumes, not prices. That is, if they increase production by 1 mbpd, it will be absorbed in a few months and the price will return to the carrying capacity level. Similarly, if they cut production, GDP growth will be restrained and oil consumption will fall until the price returns to the carrying capacity level. The collapse of price volatility in Brent suggests that this model is correct.
Third, the “cartel” is involuntary. It is the result of an oil supply that is simply unable to keep up with demand regardless of the amount of money thrown at it. The effect is the same as a cartel, I think, but there is no collusion, merely a depleting asset reaching a mature stage.
Finally, supply-constrained modeling implies much, much more than just a cartel price. It implies falling oil consumption in some countries, capex compression at the majors, improving access terms in heretofore restricted countries, etc. It’s a system of analysis, not a price point.
By the way, I anticipate we will see accusations of monopsonistic price fixing by the oil majors in procuring services. Thus, expect accusations of collusion between the likes of Shell, Chevron and Exxon in the procurement of drilling services from the likes of TransOcean, Noble and SeaDrill. Why? Because as I state above, we have a volume-insensitive, “fixed” price system. That is, you can produce as much oil as you like and sell it at the carrying capacity price. More supply doesn’t suppress prices materially for more than a short period. On the other hand, the consumer will be unwilling to recognize increased costs through higher oil prices. Thus, as geology deteriorates, the oil majors will be forced to compensate entirely (or almost entirely) on the cost side. That is, they will take a drilling rig at some defined price, but not above it. If you’re TransOcean, you’d observe that the oil majors are willing to contract your rigs, but only at unfair prices. This again, will not be collusion, but rather devolves out of the nature of a supply-constrained situation.
1. So what if there are some players in the market that are price takers and some that are cartel-action? I’m not surprised! You can still analyze and discuss that.
The basic framework of a cost curve and demand curve are still relevant. And it helps to avoid the confusion of price feedback mechanism of volume change (IOW, sliding along one line to an intersection when the other line changed), versus fundamental change of the line (supply or demand CURVE) itself.
It’s not just schoolboy stuff. It’s powerful, especially in a commodity industry. You can get very complicated and layer things on top of that classical view, but you are missing a trick if you bypass it. Don’t be a macro-economist who doesn’t understand micro. McKinsey and Goldman do their best work (and I’ve seen plenty of not so good work from them), when they analyze things classically and only layer in the complexity later.
2. Very interesting about the majors. I love Exxon (almost worked there), but if they have to take it in the shorts for getting in bed with Putin, so be it. And there’s some decent info showing collusion/coordination of Russia/OPEC, news stories on meetings and the like.
But I’m glad we have a bunch of minors running around the Eagle Ford and the Bakken and the sands. That marginal barrel is from price takers in free competition, shipping all over the place. I’m sure they would love to collude too (Harold Hamm gives me a shiver with wanting “less volatility”). But they don’t have the capability. Too many of them and the legal situation over here, not amenable.
A wedge can split a chopping block thick section of tree. Would love it if we got some cheating going on. And our foreign policy needs to encourage shipping, not sanctions. Ship Persians, ship. Ship Libyan rebels, ship.
I still remember the 70s to early 80s and all the running out of oil, all the OPEC is in control stuff. If you had said in 1981 that we would crack that cartel and enjoy 20 years of cheap oil, people would have looked at you like some dreamy libertarian free market theorist. But it worked out, didn’t it.
Let’s do it again! More money for us. Less for the Russians and Saudis. If you really think oil is such a vital factor of production for the overall economy, than it puts that much more impetus on cracking the cartel and getting cheap prices.
Nony : Where do you work ?
Did James allow you to spread insider know-how ?
Work? 😉
No.
In regard to net oil exports, depletion marches on. In regard to the remaining supply of post-2005 Cumulative Net Exports (CNE) from Saudi Arabia and the (2005) Top 33 net oil exporters, the question is not whether we have depleted the remaining volume of post-2005 CNE, the question is, by how much?
Export Land Model
Following is a graph showing normalized values (year 2000 values = 100%) for “Export Land,” a simple mathematical model which assumes a production peak in the year 2000, with a -5%/year rate of change in production and a +2.5%/year rate of change in consumption. At the production and net export peak in the year 2000, the ECI ratio (ratio of production to consumption) was 2.0, or consumption was equal to half of production. The Export Land Model (or ELM) demonstrates that given an ongoing production decline in a net oil exporting country, unless they cut their consumption at the same rate as the rate of decline in production, or at a faster rate, the resulting net export decline rate will exceed the production decline rate, and the net export decline rate will accelerate with time. Furthermore, if the rate of increase in consumption exceeds the rate of increase in production, a net oil exporter can be come a net importer, prior to a production peak, e.g., the US and China.
http://i1095.photobucket.com/albums/i475/westexas/Slide1_zps53b4428b.jpg
Six Country Case History
Following is a graph showing combined normalized values (year 1995 = 100%) for the Six Country Case History. These are the major net oil exporters, excluding China, that hit or approached zero net oil exports from 1980 to 2010. Note that even as production rose by 2% from 1995 to 1999, they had already shipped, by the end of 1999, about half of their combined post-1995 CNE (Cumulative Net Exports). Also, note that estimated post-1995 CNE, based on the seven year 1995 to 2002 rate of decline in the ECI ratio, were 9.0 GB. Actual post-1995 CNE were 7.3 Gb (billion barrels).
http://i1095.photobucket.com/albums/i475/westexas/Slide2_zps6c3a6280.jpg
Saudi Arabia
Following is a graph showing normalized values (year 2005 values = 100%) for Saudi Arabia. The first three lines are actual data. The fourth line, Remaining post-2005 CNE by year, shows the estimated values, based on Saudi Arabia’s 2005 to 2012 rate of decline in their ECI ratio. I estimate that Saudi Arabia has already shipped a little over one-third of their post-2005 CNE, in only seven years (through 2012).
http://i1095.photobucket.com/albums/i475/westexas/Slide21_zpsd1963fe3.jpg
Top 33 Net Oil Exporters
Following is a graph showing the normalized values (year 2005 = 100%) for the Top 333 net oil exporters in 2005 (countries with 100,000 bpd or more of net exports). As with the Saudi graph, the first three lines are actual data. The fourth line, Remaining post-2005 CNE by year, shows the estimated values, based on the Top 33’s 2005 to 2012 rate of decline in their ECI ratio. I estimate that the (2005) Top 33 Net Oil Exporters have already shipped about one-fifth of their post-2005 CNE, in only seven years (through 2012).
http://i1095.photobucket.com/albums/i475/westexas/Slide3_zpse00789d2.jpg
And following is a graph showing the 2005 to 2012 rates of change in the Top 33 ECI ratios, by country. Based on the 2005 to 2012 data, 26 of the (2005) Top 33 Net Oil Exporters are trending toward zero net oil exports (when the ECI ratio would be equal to 1.0). This is our global net export supply base:
http://i1095.photobucket.com/albums/i475/westexas/Slide1_zps5a656e89.jpg
As shown on the above charts, we know what the initial declines in the ECI Ratio (ratio of production consumption) meant for a mathematical model and an empirical case history, in regard to post-export rates of depletion in remaining Cumulative Net Exports (CNE), the question then is what do the post-2005 declines in the Saudi and Global ECI Ratios mean?
The (Export Land) model and the empirical (Six Country) case history show that the rate of depletion in post-export peak CNE (Cumulative Net Exports) exceeded the rate of decline in the post-export peak ECI ratio, i.e., the remaining cumulative supply of net exports fell faster than the rate of decline in the ratio of production to consumption.
This implies that the rates of decline in post-2005 Saudi and Global post-2005 CNE exceed their respective rates of decline in their ECI ratios.
The seven year (2000 to 2007) exponential rate of decline in Export Land’s ECI ratio was 7.8%/year. The seven year (2000 to 2007) exponential rate of decline in remaining post-2000 CNE from Export Land, i.e., the exponential rate of depletion in post-2000 CNE, was 43.0%/year.
The seven year (1995 to 2002) exponential rate of decline in the Six Country ECI ratio was 2.7%/year. The seven year (1995 to 2002) exponential rate of decline in remaining Six Country post-1995 CNE, i.e., the exponential rate of depletion in post-1995 CNE, was 26.0%/year. (Based on the seven year, 1995 to 2002, rate of decline in the Six Country ECI ratio, the estimated Six Country post-1995 CNE depletion rate was 17.0%/year).
The seven year (2005 to 2012) exponential rate of decline in the Saudi ECI ratio was 4.9%/year. The seven year (2005 to 2012) estimated exponential rate of decline in remaining Saudi post-2005 CNE, i.e., theestimated exponential rate of depletion in post-2005 Saudi CNE, was 6.6%/year.
The seven year (2005 to 2012) exponential rate of decline in the (2005) Top 33 ECI ratio was 2.0%/year. The seven year (2005 to 2012) estimated exponential rate of decline in remaining Top 33 post-2005 CNE, i.e., the estimated exponential rate of depletion in post-2005 Top 33 CNE, was 3.4%/year.
In regard to Russia, the five year (2007 to 2012) exponential rate of decline in their ECI ratio was 2.3%/year. The five year (2007 to 2012) estimated exponential rate of decline in remaining Russian CNE, i.e., the estimated exponential rate of depletion in in post-2007 Russian CNE, was 4.0%/year.
When comparing real income to real output, it is important to use the same price deflator for both measures. Do this and the first chart will show a different conclusion.
Not so sure; see this post.
Hey Menzie — Another fascinating post. It’s generally thought that a chunk of that Manufacturing Value Added growth after 1997 may not have actually happened. It’s a statistical artifact of a widespread index numbers problem in gov’t statistics collection, whereby cheaper (and more numerous) intermediate imports get reported as higher domestic value-added. See Houseman et al. 2010: http://www.aeaweb.org/articles.php?doi=10.1257/jep.25.2.111
Mr Campbell, this thread was authored by, Professor Hamilton.
Please report to the dean’s office for Student Affairs!
Ah, yes, as soon as I posted I realized the mistake… My apologies to Professor Hamilton.
I’ve long wondered that the way the Fed calculates industrial production causes us to understate the growth in industrial output.
Over the years industrial production of high tech goods has grown much faster than output of other goods.
But in the IP data high tech’s share of output and capacity steadily declines — a decade ago it was 15%
and now it is about 7%.
That is because the deflater for high tech goods is frequently higher than the output growth of high tech.
If output grows 15% and prices fall by 20% nominal output falls by 5%
and the Fed uses the value of nominal production to determine the weight to give each sector in the
next year’s calculation of production and capacity.
So you have a situation where in year zero high tech output grows 2 or 3 times as fast as all other
but in year two high tech’s share of production and capacity is smaller than it was in year zero.