Productivity outpaces real wages, deflated using the output deflator, or using the CPI.
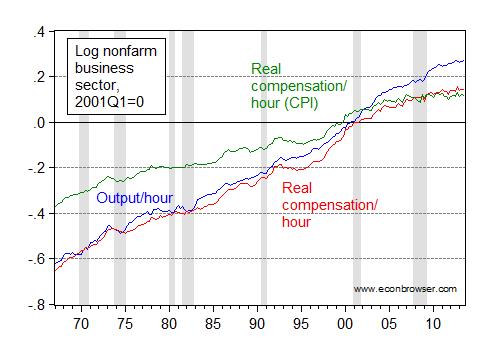
Figure 1: Log productivity (blue), log real compensation using output deflator (red) and using CPI (green), in the nonfarm business sector, all rescaled 2001Q1=0. NBER defined recession dates shaded gray. Source: BLS via FRED, NBER, author’s calculations.
Note that a large portion of the gap between productivity and real compensation is due to the use of the CPI index as the deflator. Nonetheless, the gap still exists using the output deflator. And that gap (mechanically) explains the declining labor share of income in nonfarm business sector.
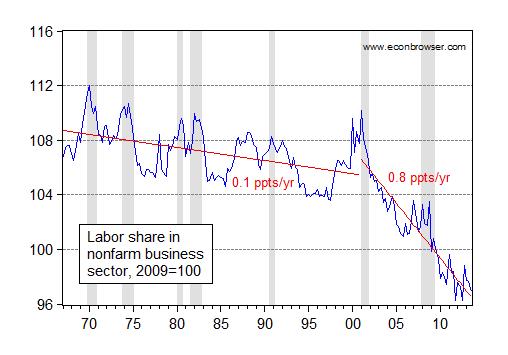
Figure 2: Share of labor income in nonfarm business sector, 2009=100. Red lines are for 1967Q1-2000Q4 and 2001Q1-2013Q3 linear trends. NBER defined recession dates shaded gray. Source: BLS via FRED, NBER, author’s calculations.
The rate of decline is 0.8 ppts of GDP per annum after 2000, while it is a mere 0.1 ppts from 1967-2000. What’s the explanation for this precipitous decline in the labor share? I’m going to appeal to a recent (Fall 2013) BPEA article by Elsby, Hobijn and Sahin:
Over the past quarter century, labor’s share of income in the United States has trended downwards, reaching its lowest level in the postwar period after the Great Recession. Detailed examination of the magnitude, determinants and implications of this decline delivers five conclusions. First, around one third of the decline in the published labor share is an artifact of a progressive understatement of the labor income of the self-employed underlying the headline measure. Second, movements in labor’s share are not a feature solely of recent U.S. history: The relative stability of the aggregate labor share prior to the 1980s in fact veiled substantial, though offsetting, movements in labor shares within industries. By contrast, the recent decline has been dominated by trade and manufacturing sectors. Third, U.S. data provide limited support for neoclassical explanations based on the substitution of capital for (unskilled) labor to exploit technical change embodied in new capital goods. Fourth, institutional explanations based on the decline in unionization also receive weak support. Finally, we provide evidence that highlights the offshoring of the labor-intensive component of the U.S. supply chain as a leading potential explanation of the decline in the U.S. labor share over the past 25 years.
So Figure 2 suggests the decline in labor’s share is partly a statistical artifact. However, capital substitution and import competition do seem to be important drivers of the actual decline. As does the lack of unionization. Figure 10 from the paper highlights the relationship.
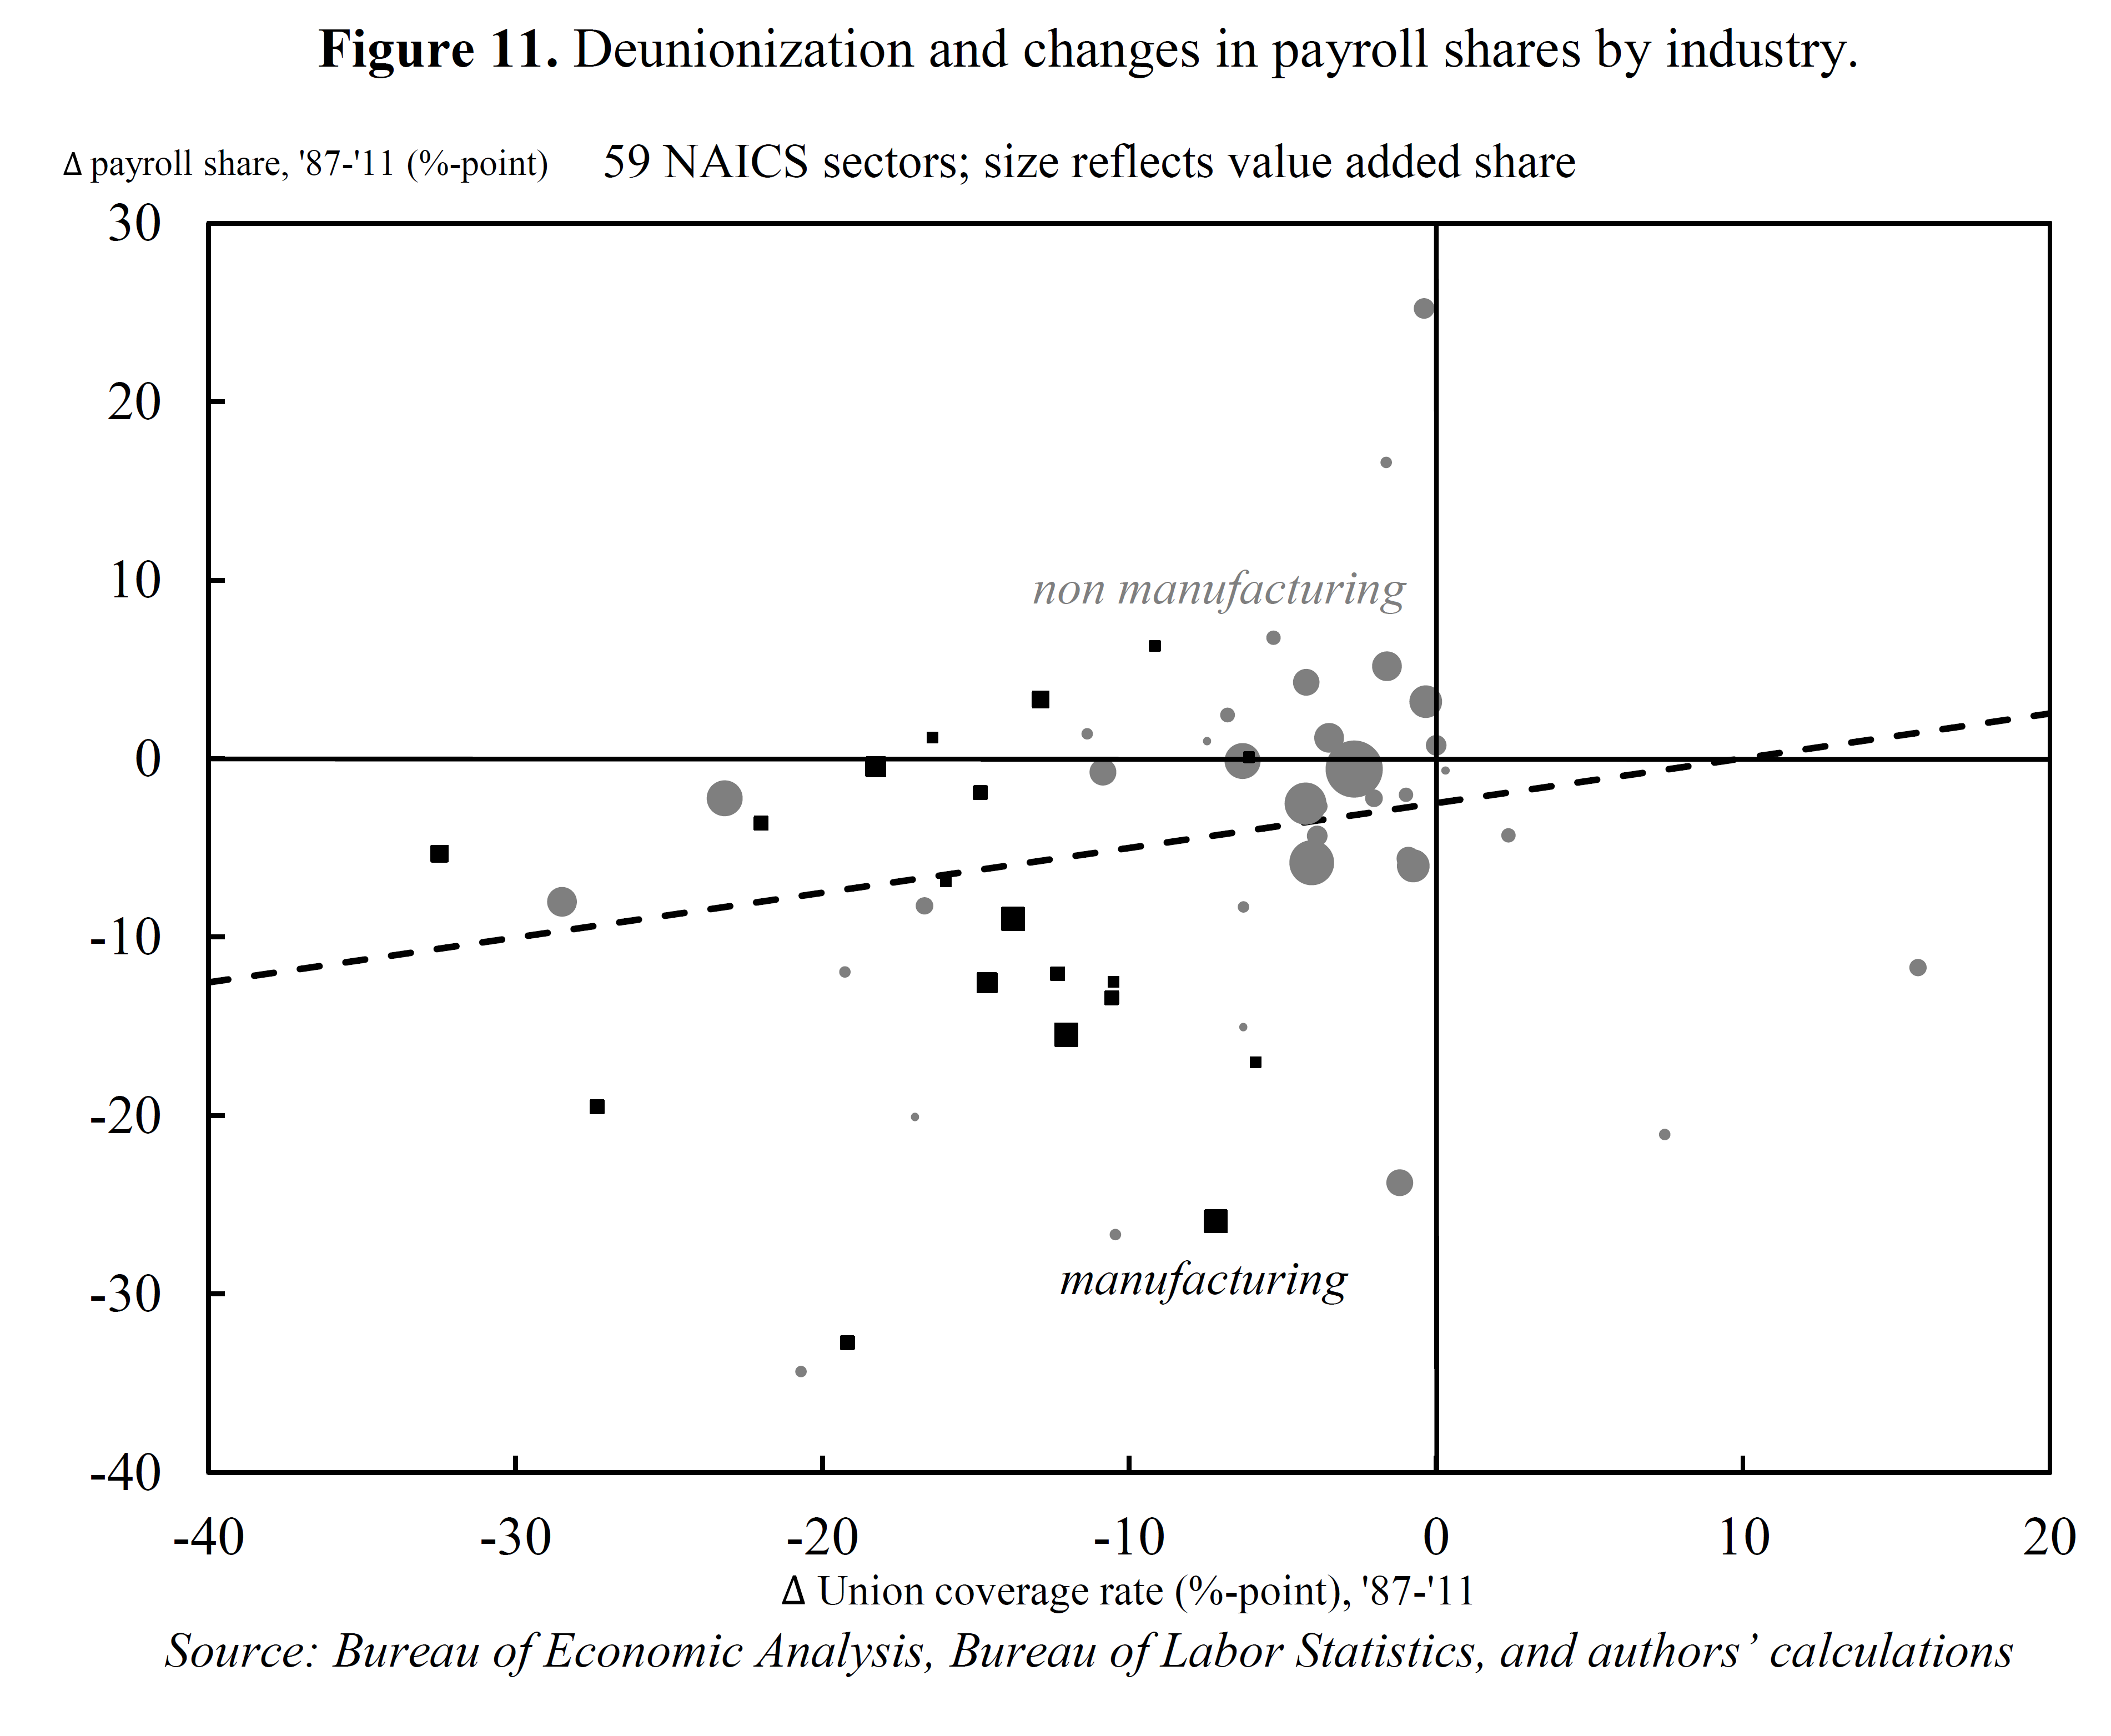
Figure 11 from Elsby, Hobijn and Sahin, “The Decline of the U.S. Labor Share,” BPEA (Fall 2013). (Figure corrected 12/10, 5:20PM)
While it is difficult to imagine arresting the effect of the first two factors, it seems to me the third might be amenable to government policy — or at least policy measures aimed at dismantling unions.
Offshoring and labor arbitrage.
Soaring debt to wages and GDP.
Financialization of the economy.
The US imported “labor productivity” from Mexico and China-Asia in the form of cheaper goods, replacing wage gains for the bottom 90% of US workers with debt to wages to purchase cheaper imports.
The incremental gains from financialized speculative rentier activities went primarily, and eventually solely, to the top 0.1-1% to 10% who own 40% to 85% of US financial wealth.
The IT industry enabled the financial industry’s growth as a share of GDP, whereas the effect of financialization became self-reinforcing for IT and the FIRE sector.
Now the growth of smart systems, search, social adapps, Big Data, robotics, 3D printing, and the cloud are cannibalizing existing industries at an unprecedented rate and scale.
Labor productivity will likely not grow, whereas smart system and non-labor productivity (cost per transaction per unit per unit time) is set to go parabolic, reducing paid employment, incomes, and purchasing power like never before, risking the end of the mass-consumer economy within a generation.
The US has not created a net new private full-time job per capita in 30-35 years.
Capital formation to GDP is where it was 20 years ago.
Whatever the system is we have, it’s not “capitalism”. Socialism depends upon a growing capitalist surplus to redistribute to the non-owners. The end of capitalism is the end of socialism.
What’s next?
The most likely candidate emerging is some variation of the increasingly privatized, militarist-imperialist, rentier corporate-state in which virtually everything of economic value is owned by the top 1%, and eventually the top 0.01-0.1%. This will leave the rest of us competing for nothing with foreign slave labor, smart systems, robotics, and “humachine” artificial intelligence (and eventually artificial super-intelligence) that consumes a growing share per capita of resources, techno-scientific knowledge, and capital to sustain an Elysium-like techno-scientific utopia for the top 0.01-0.01% to 1%.
No one will be able to compete for resources, employment, purchasing power, and status with ubiquitous ASI operating 24/7 in the dark at the speed of light, requiring no sleep, food, paid time off, medical insurance, maternity leave, companionship, or bathroom breaks.
There is a point at which human labor and purchasing power displacement by machine intelligence and capacity renders humans irrelevant to a self-sustaining fully automated economic system.
The system will not survive with humans having to compete for subsistence survival with increasingly capable, and then superior, machine intelligence able to produce infinitely more per unit of energy and time per capita than humans.
In this context, labor productivity as it is perceived is already an irrelevant metric given the accelerating automation of human labor now only beginning to occur in the services sector.
The sectors most susceptible to “disruption”, cost reduction, and labor and purchasing power elimination are “health care”, “education”, and gov’t.
How does one increase the productivity of well-paid (costly) medical personnel? Easy, replace them with medical smart systems, telepresence, robotics, health station kiosks, bioinformatics, and biometric sensors and diagnostics so that medical smart systems can handle infinitely more patients than human personnel.
“Education” (credentialing?)? Same thing. MOOC delivered asynchronously at self-pace 24/7 anywhere on the planet via all manner of inexpensive smart devices, telepresence, and interactive media and content, reducing costs per credit to a fraction of today’s costs, eliminating millions of teachers, professors, administrative staff, and salaries, benefits, pensions, costly structures, utility and maintenance costs, etc.
The Great Disruption has barely begun. A radically new system of creation and distribution of purchasing power is desperately required before it’s too late.
The key is to have models that explain how a drop in labor share affects things from productivity, unemployment, capacity utilization, investment to monetary policy, inflation, aggregate demand and real output potential.
Figure #2 shows something unprecedented and unexpected happened to demand.
I developed my own models over the past year… and economics at large needs to develop its own models quickly.
We can solve the off-shoring problem by tariffing imports by the difference between foreign-valued labor content and desired US labor rates. Then business can arbitrage manufacturing efficiency, transportation costs, resource costs, etc., but not labor cost.
Overall, I find the substance of this post heartening.
First, the key thesis seems to be Blame it on Beijing (or Mexico, as you prefer), which many of us have been contending for some time. The authors appear to share the view: “[T]he offshoring of the labor-intensive component of the U.S. supply chain as a leading potential explanation of the decline in the U.S. labor share over the past 25 years.”
This is good news because these pressures should ease, at least for those involved in manual labor, as the economy in China develops. (It’s less favorable for the professional class, perhaps.)
Moreover, productivity appears to be running ahead of wages. This in turn gives wages some room to run if external factors become more accommodating.
So, even if the present is not the best, there seems some potential upside down the line.
“So Figure 2 suggests the decline in labor’s share is partly a statistical artifact. However, capital substitution and import competition do seem to be important drivers of the actual decline. As does the lack of unionization.”
I’m not sure I buy the idea that capital substitution is a factor in the decline of labor share. Physical capital accumulation has slowed substantially in the past quarter century.
See for example this paper by Robert Gordon (Table 3):
http://faculty-web.at.northwestern.edu/economics/gordon/335.pdf
The rate of change in the capital input was 3.30% from 1950-64, 5.11% from 1964-72, 4.46% from 1972-79 and 4.76% from 1979-87. But it slowed down to 2.33% from 1987-96.
The BEA’s most recent data shows that real private non-residential fixed assets increased at a rate of only 2.61% from 1996-2007:
http://www.google.com/url?sa=t&rct=j&q=&esrc=s&frm=1&source=web&cd=4&cad=rja&ved=0CEIQFjAD&url=http%3A%2F%2Fwww.census.gov.edgekey.net%2Fcompendia%2Fstatab%2F2010%2Ftables%2F10s0707.xls&ei=Csf2UaPgE5TI4AOTooH4DQ&usg=AFQjCNFyjq34zjYzOqZd97boG68_s0WPKA&sig2=UYstWYEx8fVcf7FXEAPP_g
Recent data from the BLS suggests that if anything this downward trend has accelerated:
http://www.bls.gov/mfp/mprdload.htm
“So Figure 2 suggests the decline in labor’s share is partly a statistical artifact. However, capital substitution and import competition do seem to be important drivers of the actual decline. As does the lack of unionization.”
I’m not sure I buy the idea that import competition has been a factor in the decline in labor share either.
Here’s a good paper on the impact of globalization on the labor share of income:
Effects of Globalization on Labor’s Share in National Income
Anastasia Guscina
December 2006
Abstract:
“The past two decades have seen a decline in labor’s share of national income in several industrial countries. This paper analyzes the role of three factors in explaining movements in labor’s share––factor-biased technological progress, openness to trade, and changes in employment protection––using a panel of 18 industrial countries over 1960–2000. Since most studies suggest that globalization and rapid technological progress (associated with accelerated information technology development) began in the mid-1980s, the sample is split in 1985 into preglobalization/pre-IT revolution and postglobalization/post-IT revolution eras. The results suggest that the decline in labor’s share during the past few decades in the OECD member countries may have been largely an equilibrium, rather than a cyclical, phenomenon,
as the distribution of national income between labor and capital adjusted to capital-augmenting technological progress and a more globalized world economy.”
http://www.imf.org/external/pubs/ft/wp/2006/wp06294.pdf
The results on page 20 (Table A2.1) are relevant. Trade openness has a significant positive effect on the level (but not rate of change) of labor share of income pre-1985 and a significant negative effect on the level of labor share of income post-1985. More importantly is the effect of trade with developing countries, which is significantly positive in levels pre-1985 and positive although insignificant post-1985.
“So Figure 2 suggests the decline in labor’s share is partly a statistical artifact. However, capital substitution and import competition do seem to be important drivers of the actual decline. As does the lack of unionization.”
And the same thing applies to unions. I’m not sure I buy the idea that they are a factor in the decline of labor share of income.
The biggest problem with the theory that the decline of unions are responsible for the decline in the labor share of national income is that the decline in labor share of national income was essentially universal throughout the advanced world, and yet union coverage rates have not declined everywhere. See Figure 10 on page 14:
http://www.cepr.net/documents/publications/unions-oecd-2011-11.pdf
Note that union coverage rates increased from 1980 to 2007 in Finland, France, Norway, Spain and Sweden and if you look at the table I posted above the labor share of income declined by 10.8 to 18.3 points in those countries. In fact I’ve regressed the change in labor income share for these same 18 OECD members against the change in union coverage rates, and the R-squared value is 0.0038 meaning that only 0.38% of the change in labor share of national income can be explained by the change in union coverage rates.
This is not to say that union coverage rates aren’t an important factor in explaining changes in the *distribution of labor income*. It’s just that they don’t match up the data on changes in *labor share of national income* very well.
For example the peak year for unionization in the US was 1954 when 34.8% of all wage and salary workers were in a union (see Table A-1):
http://digitalcommons.ilr.cornell.edu/cgi/viewcontent.cgi?article=1176&context=key_workplace
At that time the labor share of National Income was only 61.8%. By the time labor share of National Income peaked at 67.7% in 1980 union membership had already declined to 22.3%. By 2003 union membership had dropped to 12.4% and yet the labor share of National Income in 2011 was 62.1%, or higher than when union membership was at its peak.
Labor compensation reached its peak share (67.7%) of National Income in 1980:
http://research.stlouisfed.org/fred2/graph/?graph_id=98737&category_id=0
And that happens to be the peak year for inflation as well. Coincidence?
The labor share of income during the age of disinflation has declined pretty much everywhere in the advanced world.
Peak Core CPI Rate*, Peak and Recent Labor Share of Income (Total Economy) (*Except Portugal)
Nation——CPI-Year– Peak-Year-Recent-Year-Change
US———-12.4-1980-69.6—1980-63.7—2010–5.9
Japan——-20.2-1974-72.5—1977-56.6—2009-14.9
Germany——6.8-1974-76.3—1974-68.5—2011–7.8
UK———-22.1-1975-75.6—1975-71.3—2010–4.3
France——12.7-1980-79.2—1981-68.4—2010-10.8
Italy——-22.3-1980-83.4—1971-68.1—2010-15.3
Spain——-26.4-1977-76.4—1977-59.9—2011-16.5
Canada——11.1-1980-68.1—1971-59.8—2008–8.3
Australia—12.8-1977-75.5—1975-61.3—2006-14.2
Neth.——-10.5-1975-77.1—1975-68.5—2010–8.6
Sweden——12.5-1980-77.9—1978-63.3—2011-14.6
Switzerland–8.9-1974-67.5—2002-65.9—2010–1.6
Austria—–11.1-1981-98.5—1978-66.3—2011-32.2
Norway——12.2-1981-73.7—1977-55.4—2011-18.3
Portugal*—33.1-1977-83.9—1975-66.4—2010-17.5
Denmark—–10.6-1978-73.7—1980-69.5—2011–4.2
Finland—–17.5-1975-76.9—1991-66.1—2011-10.8
Ireland—–21.2-1981-79.3—1980-60.9—2010-18.4
New Zeal.—–17.2-1982-60.7—1975-49.0—2006-11.7
The international labor share data comes from the OECD and is not consistent with BEA data:
http://stats.oecd.org/Index.aspx?queryname=345&querytype=view
Select *Total Economy*.
Although there are many reasons for the increase in inequality that we have seen in the US and in other parts of the world (regressive taxation, weaker unions, lower minimum wages, globalization, Skills-Based-Technological-Change (SBTC) etc.) the leading hypothesis for why there has been such large scale declines in the labor share of factor income is disinflation (i.e. tight monetary policy).
Disinflation during the eighties and the nineties was accompanied by a significant rise in the profit share of national income in most OECD countries or, equivalently, by a reduction in the labor share. This suggests that changes in the rate of inflation are non-neutral with respect to the distribution of factor income. The consequences of inflation upon inequality thus may largely be the indirect result of the effects of inflation upon factor shares. The mechanism by which this comes about is fairly simple. Accelerating inflation is correlated to falling unemployment rates, falling unemployment rates lead to greater labor bargaining power, and greater labor bargaining power is correlated with lower markups. Furthermore, higher inflation rates create greater price dispersion leading to greater competition among producers to limit markups. This hypothesis was tested with a panel of 15 OECD countries over the period from 1960 to 2000 and a robust positive relationship between inflation and the labor share was obtained:
http://pareto.uab.es/wp/2000/46000.pdf
Just out of curiosity, do we have any theoretical model of how labor’s share should change over time?
In a hunter-gatherer society, wouldn’t virtually all of income go to labor (ie, there’s not much capital to speak of)?
If capital accumulates over time, wouldn’t we expect that capital would achieve some return, ie wouldn’t capital’s share of income be expected to increase over time?
cfaman,
I think you have an idea worth developing.
Bruce,
You may have some good points, but one of your leading sentences begins with a misunderstanding. You write “The US imported ‘labor productivity’ from Mexico and China-Asia in the form of cheaper goods…”
It seems that you’re meaning to say that the U.S. imported ‘lower unit labor costs’. Those unit labor costs combine labor productivity and wage levels. In fact, those foreign sources have LOWER labor productivity (largely because of lower capital inputs and lower skills). However, the wages are low enough to more than offset he lower productivity.
Has anyone been brave enough to study shifts in unreported income in a detailed, long-term, systematic way?
In other words, has under-the-table income changed as a percentage of reported income? This is a big question, because more jobs are now in service industries.
Factory workers received very, very little under-the-table compensation. It was only in the form of perhaps a discount on the product they made or maybe some guys taking a few supplies or tools home with them.
On the other hand many service workers receive informal tips that they do not report. We know that waiters must report tips (since the 1980s; but they are still usually under-reported – ask anyone in the industry) But there has been huge growth in hospitality (e.g. hotels), home services (gardening, nannies) and many, many other services. It seems very common to leave little cash tips and bonuses. Those tips and bonuses add up. When we leave a few dollars for the hotel maid, it is not reported. Many people work completely informally, taking only cash.
This is a big deal and it’s a travesty that the economics profession, both government and academic, does not objectively attempt to measure it.
Steven, Mark, and Edward, the model Steven seeks is the Long Wave (LW), which is generally perceived as archaic or quackery among economists because it is largely structurally deterministic, stubbornly resisting Keynesian or supply-side tweaks; yet, it is the best long-term macroeconomic model there is.
The LW rhythm can be discerned from the best data available for interest rates, prices, etc., going back at least to the 17th century.
Wittingly or otherwise, Summers recently alluded to the LW Trough, albeit not by name, when he described the current period as a “secular stagnation”. What he did not describe were the causes, which are debt, demographics, and wealth and income concentration contributing to, and exacerbating, decelerating money velocity (and the “liquidity trap”), real GDP per capita, wages, and asset bubbles that act as a vacuum for savings, investment, production, and purchasing power of labor.
A LW trough to trough lasts approximately a lifetime, having three Kuznets real estate and infrastructure rhythms, within which there are Juglar business equipment investment rhythms, sub-divided further by Kitchin cycles for inventories.
The terminal phase of the LW is a debt-deflationary LW Trough during which the weakest Juglar and Kitchin cycles occur (where we are today) of the entire LW, including a terminal deceleration of wage, commodity, and general price inflation lasting 2-3 Kitchin cycles.
Demographic effects (coming of age and peak spending of a peak demographic cohort) are a primary driving force, as is the debt cycle, culminating in a cumulative differential order of exponential magnitude of growth of debt to GDP and wages (occurred in 2008), which terminates at the onset of the debt-deflationary LW Trough earlier mentioned (only this time the debt deflation has been postponed by central bank printing and record deficits/GDP).
Labor’s share of GDP declines during the disinflationary/reflationary LW Downwave that follows the LW Peak (in the rate of inflation and interest rates), as reflationary gains accrue disproportionately to capital, specifically financial capital this time around since the early 1980s.
Consequently, wealth and income inequality rises with the reflationary secular bull market for equities and bonds by virtue of the fact that those who own a majority of the financial assets in the first instance, i.e., the top 1-10% of households, experience disproportionate gains vs. gains to labor’s share.
The LW Trough is characterized by an ongoing deceleration of real GDP per capita to near 0% or negative.
The LW Trough resolves only when a sufficient share of debt (and by extension asset values) to wages and GDP is cleared, equity prices reach a secular bear market bottom at a P/E of 8-10***, price inflation declines or deflation occurs and persists, interest rates bottom, commodities prices bottom, and wages as a share of GDP bottom and begin to accelerate.
Unfortunately, we are nowhere near resolving the LW Trough. Therefore, the LW implies slow or no growth or real GDP per capita will persist; high structural unemployment will continue; private investment and production will be weak; capital accumulation will not accelerate; capacity utilization will be below the historical average; wage growth will be weak; debt to GDP will not resume acceleration; and eventually overvalued assets will be liquidated/consumed in place of growth of incomes, revenues, and profits.
All of this implies that Fed/bank printing in a desperate attempt to create a dubious “wealth effect” in order to encourage faster growth
Moreover, the implied potential real GDP of 2.2% and the assumed growth gap are erroneous. The post-2007 trend real GDP per capita hereafter is near 0%, including more frequent recessions (or mid-cycle decelerations during a Juglar Cycle); Therefore, there is no growth gap; rather, the “new normal” for real GDP per capita is 0% +/- 0.8%.
The 10-year Treasury yield is heading back to the 1% range along with trend nominal GDP and the 5-year trend rate of wages.
The LW Trough will not resolve (and set up a new inflationary LW Upwave) until debt/assets to wages and GDP declines ~30-40% (or more), or GDP and wages catch up to debt; but that will require 20-25 years at the current secular trend rates of GDP and wages. Now that’s a “secular stagnation”.
These conditions will persist in the US, EU, and Japan, eventually affecting China-Asia as demographic drag effects bear down on the Middle Kingdom and her Asian neighbors, especially the Asian city-states.
Because the economy is now integrated globally with unprecedented debt/GDP and wages, population overshoot, and Peak Oil, it is not inconceivable that growth of real GDP per capita is over (implied by Gordon), implying that capitalism is done, which in turn might suggest that there will be no inflationary capitalist LW Upwave hereafter.
It’s time for economists to go back to the old school to study Kondratiev, Schumpeter, Juglar, Kitchin, Forrester, Berry, et al.
***Secular bear markets for stocks historically wipe out all inflation- and currency-adjusted gains to stocks from the beginning of the previous secular bull market, leaving the investor a return no higher than the average dividend yield (before fees and taxes) over the secular bull and bear market eras. Should the pattern repeat this time around, the S&P 500 will again decline to the 600s (constant US$) to a P/E of 8-10, market cap to GDP of 30-35%, and a Q ratio of 0.6.
Curious how the labor share decline doesn’t come up when Menzie talks about increasing the minimum wage or extending UI.
I can hardly believe that some of you are finally realizing that globalization is the primary cause of our woes. Academic economists have for decades denied this and, in consequence, prevented the adoption of strategies to compensate for global forces. Never mind that this has been in FLAT CONTRADICTION OF BASIC ECONOMIC THEORY. We live in an era when productive capital is mobile and when the developing economies can match us in productive efficiency. Of course productive capital will transfer from where capital is abundant and rents are low to where capital is scarce and rents are high. This is what commonsense says will happen, it is what theory says will happen, it is what has happened. Everyone who has lost a well paid manufacturing job to end up waiting tables knows it. The only ones who do not understand it are academic economists.
For those interested, below is a simulation of trade with international capital mobility. To say it is well micro-founded is an understatement. Almost any reasonable set of parameters will yield similar results. Data is taken straight from a standard computer model of trade, adjusted to allow for international capital transfer.
It begins with two regions M and N. M is capital rich, N is capital poor. Assume, an HO type scenario where N can match M in productive efficiency and capital is mobile between regions. We model three sectors, A, B, C. B is labour intensive, C is capital intensive. A is neutral and the numeraire ($10). Wages and rents are determined, as usual, by equating them with price x marginal products. Post-trade pricing is by Walrasian auctioneer (all markets clear). The model respects that international capital transfer is a slow process by recalculating the trade position after each 10 unit capital transfer.
Production functions for M and N.
A: K^0.5L^0.5
B: K^0.4L^0.6,
C: K^0.7L^0.3
They start with capital/labour ratios of M: 900/30 and N: 30/60. Here are their pre-trade (autarky) positions: (G = Global)
Output Vectors
M:___56.36___57.65___61.10
N:___14.33___14.49___13.91
G:___70.69___72.13___75.01
Price Vectors
M:___10.00___13.85___ 4.61
N:___10.00____9.00___10.93
G:___10.00___12.88___ 5.78
Rents/Wages
M:____0.89___28.18
N:____7.67____3.26
Rental Income/Labour Income
M:__798.44__845.40
N:__230.22__195.47
Rentier Share/Labour share
M:___48.57___51.43
N:___54.08___45.92
GDP
M:_1643.84
N:__425.68
G:_2069.52
Trade ensues with the expected results. There is a shift to capital intensive production by capital rich M and a shift to labour intensive production by labour abundant N. There is a wage loss in M – but not too drastic. Both get to share the overall gain in output.
Output vectors
M:___66.56___34.54__106.83
N:____7.55___49.71____0.00
G:___74.11___84.26__106.83
Price Vector
G:___10.00___10.93___4.79
Rents and Wages
M:____0.98___25.60
N:____7.28___ 3.43
Rental Income and Labour Income
M:__878.92__767.99
N:__218.52__308.90
GDP
M:_1555.27
N:__619.06
G:_2174.33
Given that capital is mobile between M and N, greater gains in global output are possible. If M transfers capital to N where capital is scarce those gains can be realized. The difference in rent between the two is driver for this. Rentiers in M will want to shift capital to N where it provides seven times the return. Below is the result after a 200 unit transfer.
Output Vectors
M:__60.68___0.00_163.76
N:__14.04__90.65___0.00
G:__74.72__90.65_163.76
Price Vector
G:__10.00__11.62___5.40
Rents and Wages
M:___1.32__18.96
N:___2.14__11.70
Rental Income and Labour Income
M:_1350.19__568.88
N:___64.10__702.04
GDP
M:_1491.74
N:_1193.46
G:_2685.21
Results for M:
1. Wages down 25% from post-trade.
2. Labour share falls below 30%.
3. GDP is down 4%.
4. Rental income has increased by 50%. (Rentiers dine out every night).
The trade/transfer process terminates with a global (Pareto) maximum. Final cap/lab ratios are M: 480/30, N: 450/60 at which point trade alone equalizes factor prices and capital transfers yield no further global gains (echoes a famous result of R.Mundell).
Output Vectors
M:__27.08___6.16_152.31
N:__48.65__86.94__17.17
G:__75.74__93.10_169.48
Price Vectors
G:__10.00__12.24___5.93
Rents and Wages
M:___1.66__15.05
N:___1.64__15.20
Rental Income and Labour Income
M:_1488.10__451.41
N:___49.33__912.25
GDP
M:_1248.91
N:_1652.18
G:_2901.09 (Global max)
Final results for M:
1. Wages down 40% from post-trade.
2. Labour share falls below 25%.
3. GDP is down 20% from post-trade.
4. Rental income has increased by 70%. (Rentiers in M now earn more than half of all global GDP).
This is a simple static model – but it is all there. In a dynamic context (with capital formation and technology improvements) it translates to slow growth, stagnant wages, stagnant labour productivity, lack of business investment, increasing inequality and a big rise in incomes at the very top of the scale reflecting the rapid growth of rentier income. Trade cannot find an equilibrium in a world of changing capital/labor ratios, so structural unemployment caused by trade extends into the long term. The likely result is a gradual decline in the labor participation rate as labor markets fail to keep up with the constant structural churn.
As well as the above long term effects, the model also explains our recent economic experience. In a downturn, the capital transfer continues even as capital formation slows. Fiscal stimulus is compromised, not just through a high propensity to import, but also because investment abroad can satisfy local demand – the expected domestic investment response is missing. Recovery is protracted as the capital drain erodes the output gap leaving less headroom for expansion. Labor productivity and consequently real wages may fall in this scenario as labor has less capital to work with, further dampening demand (UK “productivity puzzle”). On this view, losses are structural and permanent. The economy never recovers the output lost in the recession.
Still not getting this? In that case you are probably an academic. Relax and repeat the mantra: “Globalization and free trade are always good…” and be thankfull you have a well paid job.
@Floxo: Brilliant. Thanks.
“Trade” and “globalization”, like it or not, is a euphemism for a neo-colonial/neo-imperial trade regime, not unlike that of Victorian Britain.
Economists are reluctant to examine and describe the colonial/imperial nature of Anglo-American “globalization” for obvious reasons, not the least of which is that they do not want to offend the rentier elite top 0.01-0.1% and their banker and executive managerial caste who are the principal beneficiaries of financialization and “globalization”.
One can’t blame economists for assuming their historical role as imperial ministerial intellectuals and failing to bite the hand of the giant beast that feeds them. But neither should they get credit for devising erroneous, self-serving models and engaging in group self-validation in service to the beast.
Rent seeking of 7-10%+ returns by the rentiers in an economy that is only capable of labor returns of ~2-3% is the primary cause of debt-money inflation (growing faster than wages, production, and capital stock), price inflation, and loss of real purchasing power of labor, which in the long term reduces final demand and the rate of real GDP per capita.
Moreover, “trade” encourages importing costlier low-multiplier luxury goods consumed by the top 0.1-1% to 10%, which in turn gives incentives to shift the domestic and foreign production structure from higher-order capital goods and consumer goods for the masses in favor of low-multiplier production of luxury goods for the wealthy.
Finally, imperial states cannot fund imperial war machines, expand “trade”, subdue enemies, and co-opt foreign elites at non-inflationary labor returns of 2-3%. Empires need war, money and price inflation, resource expropriation, and conquest of foreign markets.
@tew: Good point. Thanks. We import cheaper goods produced by cheap labor by workers at US supranational firms’ subsidiaries’ production and contract producers, whereas the bottom 90% working class are required to give up capital deepening, higher productivity, and real wage gains in exchange for increasing debt to wages at falling nominal interest rates of the LW Downwave. The effect for consumers and businesses is importing the gains from increasing capital deepening of foreign labor at lower wages.
I find it interesting that the decline in labors share coincides with the change in net investment since 1980. Since 1980 the information technology has grown from an insignificant share of business fixed investment to about half. But the life span of IT capital is much shorter than more traditional. So while GDP is showing a rising share of GDP allocated to business investment, when you adjust for the shorter life span of IT, net capital spending has contracted as a share of GDP. So maybe the declining share of labor is a simple story that we have to run faster to stay in place.
http://www.voxeu.org/article/fdi-africa
Africa, the final frontier for US and European supra-national firms’ colonial/imperial FDI, “trade”, and the final battlefield for the last-man-standing contest between the West and China for the planet’s remaining resources.
Africa was also in play during the colonial/imperial LW Trough wars in the 1890s-1900s and during the 1930s-40s.
@Spencer: Good point, but note that the decline in labor’s share also coincides with US deindustrialization and financialization following the peak in US crude oil production in 1970-85, after which it has fallen 50% per capita after growing 4-5% for 50-70 years before 1970.
And, yes, IT as the “leading sector” of the LW Downwave is now a primary fixed cost of the modern post-industrial, financialized economy’s firm that has seen the product cycle decline from ~3-4 years to perhaps 10-12 months (?), with increasing cannibalization of product lines and sectors, and diminishing returns to product differentiation (“me-tooism”) and to incremental investment per worker and revenue (see Schumpeter).
Again, per Schumpeter, we will now see the “leading sector” IT in its maturation stage integrate with the emerging “leading sector” in its “take off” phase, but yet to be fully defined, including smart systems, quantum/nano-electronic/photo-electronic/biological computing, AI, robotics, bioinformatics, biometrics, Big Data, biotech, nanotech, 3D printing, internetworking, wireless, its primary benefit to the existing capital, cost, and production structure, and the division of labor, being to eliminate labor inputs and costs at increasing scale and at ever smaller time scale.
These developments will occur with slow or no real GDP per capita and “trade”, implying a mass consolidation of capacity worldwide, including mergers, asset spin-offs, eliminating lines of business, firing millions of workers, and so on.
As a result, economics will have to go back to the drawing board (or the tablet or handheld smart device or quantum/molecular AI algorithms) to remain relevant, about which I have serious doubts.
The emerging techno-scientific, techno-economic, socio-cultural developments occurring at the speed of light, in the dark, 24/7 around the world risk being so disruptive at global scale (and at the atomic scale) as to render irrelevant everything we “overeducated”, self-satisfied types have deluded ourselves into thinking we know about “the economy” and economics.
On one hand the authors’ approach to measuring the impact of offshoring and globalization may overstate the effect by treating all US imports as a manifestation of outsourced production. Many types of commodities were imported by the US long before the growth of outsourcing as a strategy by US multinational companies.
On the other hand the approach may understate the impact by looking only at US imports. Much of the outsourced production by US MNCs has been for goods that were never intended for sale in the US but rather in the host foreign countries or neighbor countries. Before outsourcing these goods were either included in domestic production as US exports or such production did not exist. However, these goods may not be as labor intensive as US imports.
Most of these comments are 100% US-centric though the same labor/investment trends are obvious in many other advanced countries. Does this simply reflect the data most readily available or the nationality of the commentators?
Or is it simple confusion? I think confusion fits the model the best but perhaps some regression work would be useful.
Looking around without the blinkers of the data/academic mindset, the emergence of China seems to touch all the bases, including the oil one.
Suitable policy responses here might include a mass prayer that Chinese wages continue to rise quickly and a serious plan to churn out less human sludge. Birth control and tougher schools would be good places to start.
c thomson: Rising trend per capita GDP is a worldwide phenomenon. Does this mean there are no idiosyncratic/country-specific factors?
Related to that point, there does not seem to be a global level of income all countries are converging to. Does this have implications for further consideration of country-specific factors? Discuss. I look forward to seeing your answer. Some mathematical precision would be appreciated.
Geez.
Mathematical precision about the future is always enjoyable.
That is why academic economists are so universally admired – especially as forecasters.
c thomson: Well, if you are mathematically incapable – as your response seems to suggest – then any grammatically correct explanation would be welcome. So, does a common trend rule out an important role for country-specific factors? I await your answer with bated breath.
Reluctantly, and against their will, academic economists are FINALLY conceding globalization is seriously effecting wages.
It is simply amazing how resistent the profession has been to this conclusion.
What is almost amazing is how resistent they are at doing anything about it.
Case in point: Robert Reich. Reich admits (and that is the word if you are familiar with his past work) that “But as low-wage work proliferates in America, so-called takers are working as hard if not harder than anyone else, and often at more than one job.
Yet they’re still not making it because the twin forces of globalization and technological change have reduced their bargaining power and undermined their economic standing — while bestowing ever greater benefits on a comparative few with the right education and connections (and whose parents are often best able to secure these advantages for them).”
Now if you believe that, wouldn’t you want to CONSIDER stopping the process. At the minimum, until you stopped the erosion in labor’s bargaining power, you should NOT be approving any more free trade deals.
But of course, Reich doesn’t go there. No academic economists do. They talk about redistribution (as if that is happening soon) or education (which limits the damage but clearly isn’t close enough).
All of this is to say this: I believe academic economists have significantly contributed to the increase in inequality by refusing to take seriously addressing the cause rather than the sympton.
Reich talks of “demagogues” but he is fact just a guilty.
The reason economists act as if there is no answer to the discontents of globlization is that they are scared of where the answer will lead them.
Because going there requires rejecting a basic premise of neo-classical economics.
Three other comments:
1. The IMF did some cross country comparison of this effect, and broke it out by skilled and unskilled. What they found was most of the decline was attributable to unskilled labot.
BUT they also find no increase in the share of income going to skilled labor – which was basically treading water.
I cannot find the link.
2. Mark A thank you for the information. The IMF paper notes that globalization is actively decreasing the positive effect of legal labor protections – which was interesting.
3. You know, China joined the WHO in 2001. Hmmm, I know correlation is not causation, but the timing is rather interesting given these charts…..
Professor Chinn repeatedly demonstrates the truth of the old adage – ‘to a hammer every problem looks like a nail.’ Dazzle them with science!
His ‘country-specific factor’ appears to relate to his enthusiasm for restoring the power of private sector unions in the US.
Even the most sincere believer in the use when applicable of math in decision making – like me – must realize that so many political factors are involved that any assumptions about the impact on labor’s share of future GDP are the purest guesstimates.
Would manufacturing companies just leave? Would fast food sales collapse over time? Would the Chinese dump US debt? And what if the attempt resulted – as in Wisconsin – in the electorate dumping the union enthusiasts? What if public sector unions had collateral damage?
If Professor Chinn longs for the corporatist America of the 1950s, why not just say so? The arguments for and against are political and not amenable to rational mathematical analysis.
c thomson: I said I’d allow for a non-mathematical explanation. Let me ask the question at grade school level English, then. Is it possible for a set of countries to exhibit a downward trend in a variable, and yet experience varying rates of decline perhaps due to factors specific to an individual country? Please feel free to ask for simpler language if this question thus posed was insufficiently basic enough for you to comprehend.
Oh dear, oh dear. Of course, there are specific factors for countries that can make local economic results vary above and beyond some global or regional trend.
If, however, such a factor is basically cultural, it will not be amenable to pure statistical analysis. Non-PC thinking may well be needed to understand the true situation. Or to do anything effective about it.
Examples: WI may well be doing worse than MN because of a more entrenched case of rustbelt failure culture. This might prevail as long as locals hope for a political fix – i.e. ‘cling to the unions, don’t throw away the begging bowl’.
Singapore does better than Malaysia in a high growth region because the better educated Chinese work harder and more effectively than Malays. Affirmative action for Malays is unlikely to change the economic result, especially if religion is a contributing sub-factor.
If a fix for such differences even exists, regression analysis won’t spot it.
Not too complicated, is it?
c thomson: You should read more widely. Over a hundred years ago, the Chinese were castigated as being backward because of their dogged adherence to moribund Confucian precepts. So much for the immutability of cultural explanations. But if they make you feel better about yourself, by all means use them to organize your worldview. Just don’t think that’s rigorous thinking.
cthomson,
a mathematical model can be created for just about anything. the lack of a model is typically because one does not have the resources to construct the model, one does not have the intellectual capacity to develop the model, or one is afraid of the result-usually because it will tend to contradict an expected outcome.
menzie is asking for numbers because at that point you can better understand inputs and outcomes-and rate them accordingly. many arguments are made not because of resources or intellectual ability-but because you cannot create a rational model to support your belief which is simply “known” to be correct.
as you said:
“Would manufacturing companies just leave? Would fast food sales collapse over time? Would the Chinese dump US debt? And what if the attempt resulted – as in Wisconsin – in the electorate dumping the union enthusiasts? What if public sector unions had collateral damage?”
at least a model lets you understand the inputs and outputs, rather than simply waving ones hands and saying this is how the world works, period.
Thanks Prof. Chinn, you make my case nicely about the fatuity of making long-term predictions about economic and social matters using existing data. Napoleon said ‘when China wakes the world will tremble’ but that was a brilliant insight of more than a hundred years ago.
Economics is not a science like physics or astronomy – the Heisenberg effects are too strong.
As for Baffling, packaging up bullshit estimates in a numerical wrapper is just silly but might lead to a good Wall Street career as a derivatives salesman.
cthomson,
creating a well defined model so that others can see the inputs, how they are manipulated, and the outputs is transparent. some people may not have the analytical strength to follow the model-but that really is their weakness or laziness. but this approach is far better than some self proclaimed expert saying we need to cut spending or the interest rates are going to soar! that particular nonmathematical model has been in the talking points for the past 5 years-and wrong each and every year. it is incorrect, but hard to argue against because it has no model basis-only a feeling of the expert.
Tew asked:
Has anyone been brave enough to study shifts in unreported income in a detailed, long-term, systematic way?
The answer is basically no. What you are referring to is more commonly, in the literature, called the Informal economy. And while there are a number of studies over the years, interest in the subject is very limited, and mostly in regard to potential lost tax revenues.
One sees adjustments to GDP, and household incomes, etc, based on a number of factors, but just about never incorporating “unreported” economic transactions. Even though, by best estimates they are substantial even in a fairly dutiful country like the U.S – recent estimates put the amount below the line at about 5-8% of GDP, and perhaps more.
I have wondered over the years why the informal elements of the economy are usually ignored. Yes, the data is necessarily imprecise, still, the numbers are large enough to have a meaningful impact on understanding of the whole economic gestalt.
Second Look: The adjustments to GDP made by BEA are largely based on periodic IRS studies of misreporting on and non-filing of business income tax returns. While one can certainly argue about the extent to which those studies determine the actual level of misreported and unreported income, they are based on the reporting of business receipts and expenses. For nonfarm prorietors (self employment) income, the adjustment in recent years more than doubles the amoount reported to IRS on tax returns.
Unreported transactions are incorporated into periodic benchmark input-output tables, which provide the overall framework for GDP. These adjustments are also based on IRS reporting studies, which again may not cover the entire universe of unreported and misreported transactions.