From Reuters:
Russia is at risk of recession as investors pull money out of the country, with growth likely to evaporate if capital outflows reach $100 billion, the head of its largest bank, state-owned Sberbank, said on Monday.
Capital has fled Russia, with stocks and the rouble sliding following Moscow’s seizure of Crimea from Ukraine and western sanctions against Russian individuals. Analysts at Goldman Sachs recently predicted capital outflows for this year could reach $130 billion, or double 2013 levels.
And from K. Hille and R. McGregor in the FT, assessments from Russian government officials:
The Russian government is braced for the country’s capital outflows to soar to $70bn in the first three months of the year as investors seek cover from the fallout of President Vladimir Putin’s Ukrainian land grab.
…That would exceed the $63bn that flowed out of the country in the whole of last year and is higher than the $50bn figure mooted by Mr Putin’s economic adviser Alexei Kudrin 10 days ago.
It appears that Russia is more vulnerable to sanctions, and the threat of sanctions, than some observers believed (see discussion here). Figure 1 places in context the developments in the external balances, including net capital inflows, through 2013.
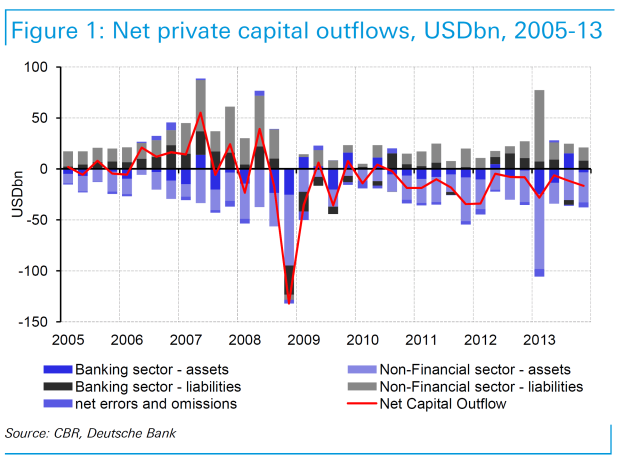
Figure 1 from Y. Lissovolik, A. Zaigrin, “Russia: macro implications of increased geopolitical risk,” Emerging Markets Monthly (Deutsche Bank, 13 March 2014) [not online].
The figures in the graph are not annualized, so net outflows of $100 billion in Q1 would dwarf those recorded in earlier quarters. There is a strong correlation between capital inflows and fixed investment (and the investment contribution to GDP growth in 2013Q4 was already zero). Figure 7 illustrates this correlation.
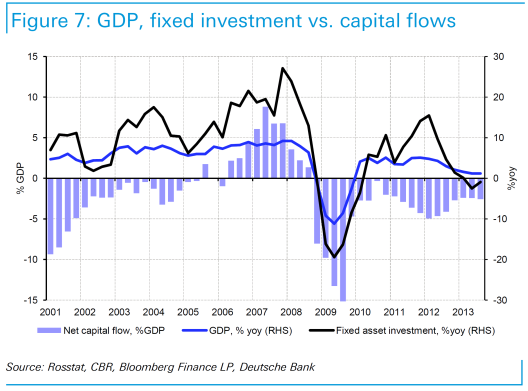
Figure 7 from Y. Lissovolik, A. Zaigrin, “Russia: macro implications of increased geopolitical risk,” Emerging Markets Monthly (Deutsche Bank, 13 March 2014) [not online].
From my own perspective, I was surprised that growth forecasts had not already been marked down to zero and below. After all, the policy rate has already been raised by 1.5 ppts to 7% as of the beginning of March. [1] A standard Mundell-Fleming analysis in the absence of balance-sheet/foreign exchange concerns suggests this measure is contractionary; with foreign currency denominated debt, the interest rate defense might make sense as the lesser of two evils, but doesn’t take away from the fact that raising the policy rate is contractionary. Admittedly, with y/y inflation at 6.2%, the increase makes real interest rates less negative, rather than more positive. In addition, with an underdeveloped and fragmented financial system, the link from the policy rate to lending rates is probably weak.
It’s of interest that these developments are occurring against a backdrop of already priced in monetary tightening in the United States. Should economic conditions induce a revision toward more rapid tightening, or general risk appetite decline, pressure on Russian external balances — and foreign exchange reserves — will only increase.
Update, 7:45AM 3/26: The World Bank has released a new assessment of the Russian Economy.
Given the higher risk environment — since political uncertainties around the Crimea crisis in early March 2014 led to an increase in market volatility, the World Bank developed two alternative scenarios for Russia’s 2014-2015 growth outlook.
- The low-risk scenario assumes a limited and short-lived impact of the Crimea crisis and projects growth to slow to 1.1 percent in 2014 and slightly picking up to 1.3 percent in 2015.
- The high-risk scenario assumes a more severe shock to economic and investment activities if the geopolitical situation worsens and projects a contraction in output of 1.8 percent for 2014.
Re: Russian Net Oil Exports
Russian net oil exports and their ECI Ratio (ratio of production to consumption) respectively increased from 5.0 mbpd and 2.9 in 2002 to 7.2 mbpd and 3.7 in 2007 (EIA data, total petroleum liquids + other liquids).
From 2007 to 2012, their net exports were at or below 7.2 mbpd, as their ECI ratio fell from 3.7 in 2007 to 3.3 in 2012.
If the ECI ratio, the ratio of production to consumption, is declining, a net exporter is mathematically trending toward zero net exports (think of it as an income to expense ratio, at an income to expense ratio of 1.0, net income = zero). From 2005 to 2012, 26 of the top 33 net exporters in 2005 showed a declining ECI ratio, which caused an overall decline in the Top 33 ECI ratio (and an overall post-2005 decline in net exports). Based on a simple model and based on a case history, the rate of depletion in post-export peak CNE (Cumulative Net Exports) tends to exceed the rate of decline in the ECI Ratio.
Here are the Russian numbers for 2002 to 2012:
Russian Net Exports & ECI Ratios (EIA):
2002: 5.0 mbpd & 2.9
2003: 5.8 & 3.2
2004: 6.5 & 3.4
2005: 6.7 & 3.4
2006: 6.9 & 3.5
2007: 7.2 & 3.7
2008: 6.9 & 3.4
2009: 7.0 & 3.4
2010: 7.1 & 3.4
2011: 7.1 & 3.3
2012: 7.2 & 3.3
Based on the 2007 to 2012 rate of decline in the Russian ECI ratio, I estimate that Russian post-2007 CNE are about 72 Gb (billion barrels), with 13 Gb having been shipped from 2008 to 2012 inclusive.
The five year (2007 to 2012) exponential rate of decline in their ECI ratio was 2.3%/year. The five year (2007 to 2012) estimated exponential rate of decline in remaining post-2007 Russian CNE, i.e., the estimated exponential rate of depletion in in post-2007 Russian CNE, was 4.0%/year.
Jeffrey,
You put a lot of work into your analysis. I think your audience would get more out of it if you chose more intuitive terms, like ” % internal consumption”, calculated by dividing internal consumption by total production. We’d have a number like “30% internal consumption” instead of 3.3 ECI. That would be a lot easier to understand.
Also, it would help to explain your comparisons in more detail. Why use 2007 as the base for “ECI” instead of 2002? A linear regression of “ECI” from 2002 to 2012 shows a slight but distinct increase, with 2007 looking like an outlier.
I use the production to consumption ratio (what I call the Export Capacity Index, or ECI), so that normalized net exports, ECI ratio and the post-export peak CNE (Cumulative Net Exports) depletion rates are all showing negative slopes. The whole point of the exercise is to estimate post-export peak CNE, once net exports stop increasing, or decline, with a declining ECI ratio.
Net exports and the ECI ratio were both increasing for Russia from 2002 to 2007, versus flat to declining net exports after 2007, with a decline in the ECI ratio from 2007 to 2012.
Jeffrey,
I don’t think you’re communicating what you want to communicate. I suspect that very few of your readers understand what you mean. I suggest you simplify it and use straightforward ratios as I suggested above. Failing that, you need to explain what you mean by things like “post-export peak CNE (Cumulative Net Exports) depletion rates”.
Finally, I suggest you chart your data and analyze it, before you use it as a basis for argument. 2007’s “ECI” appears to be an outlier, and the decline from 2008 to 2012 appears trivial. That would jump out in a chart.
I’ve begun to conclude that it doesn’t matter how well, or how poorly, that I communicate regarding “Net Export Math. Almost no one understands the concept, or they choose not to understand it. And among those who understand the concept, almost no one believes that my net export depletion estimates are even remotely credible. But as Ayn Rand said, one can deny reality, but one cannot deny the consequences of denying reality, and here is the reality:
In any case, my conclusion is that we are only maintaining something resembling Business As Usual because of enormous–and almost totally overlooked–rates of depletion in post-2005 Global and Available* Cumulative Net Exports of oil, which I estimate at about 3.4%/year and 10%/year respectively from 2005 to 2012.
*Available Net Exports = Global Net Exports of oil less Chindia’s Net Imports
Jeffrey,
I’d stay away from Ayn Rand as a symbol of an evidence based approach. Heck, her hero believed in getting energy from random static electricity…
Anyway, I take your analysis seriously. Exporters should be deeply aware that their domestic price controls and subsidies are greatly harming their long-term ability to export. Importers should be working hard to reduce their vulnerability to imports. Everyone should be working as hard as possible to transition away from oil and other fossil fuels, and moving to domestic renewable energy sources.
I understand Harold Hamm, CEO of Continental Resources, testified in front of Congress An excerpt from a Reuters article (emphasis added):
Lifting U.S. crude export ban would help counter Russia- oil CEO
http://www.reuters.com/article/2014/03/26/usa-oil-ban-idUSL1N0MM22T20140326
It’s easy to demonstrate the “overnight impact” that Mr. Hamm is talking about. Here is a link to the latest US four week running average supply data from the EIA:
http://www.eia.gov/dnav/pet/pet_sum_sndw_dcus_nus_4.htm
If we just focus on the imported crude oil supply for US refineries over the last four weeks, we (gross) exported 64,000 bpd and had (gross) imports of 7,337,000 bpd. So net imports of crude oil were:
Gross Imports – Gross Exports = Net Imports
7,337,000 – 64,000 = 7,273,000 bpd
Let’s assume that we boost gross exports by 1,000,000 bpd and to offset for the decline in supply, we then boost gross imports by 1,000,000 bpd. Net imports of crude oil would then be:
8,337,000 – 1,064,000 = 7,273,000 bpd
“I’ve begun to conclude that it doesn’t matter how well, or how poorly, that I communicate regarding “Net Export Math. Almost no one understands the concept, or they choose not to understand it.”
Jeffrey, please do not be discouraged from continuing to communicate the message of your work, which is profound. Granted, I am biased in that my own work of nearly 30 years confirms your own, and additional modeling work goes beyond your short-term projections to longer-term structural implications that are potentially too unsettling to recount here.
As such, the implications are understandably rather unpalatable to the established BAU meme, the further implications of which challenge most of the working assumptions that sustain a mass-social acceptance of the oil-, auto-, debt-based, suburban/exurban housing model that has now spread to most of the rest of the world with any capacity to emulate it.
What is more, and regrettably worse, is that the US has effectively fallen off the “Seneca cliff” as of 2005-08, with the log-linear acceleration of extraction/depletion of domestic liquid fossil fuel reserves per capita suggesting a crisis period to occur no later than 2017-21. Yet, a lack of understanding of your work implies that there is next to no possibility of a mass-social realization of our having fallen off the Seneca cliff and the intermediate- and long-term implications for growth of real final sales per capita and maintenance of the living standard for the bottom 90%+ of US households.
NIck G, there is next to no possibility that we can sustain the post-Seneca cliff liquid fossil fuel infrastructure at the current real final sales per capita AND simultaneously build out an electricity-based renewable infrastructure to scale. A Tesla or Leaf in every suburban/exurban garage, while laudable as an objective in the abstract, ain’t gonna happen, brother.
The net incremental systemic exergetic cost per capita to maintain the current real final sales per capita precludes the necessary level and rate of growth of exergetic transfer per capita from existing domestic resources and the required additional cost of building out the renewable infrastructure.
Moreover, China-Asia is 40-80+ years too late to the oil-, auto-, debt-, and suburban housing model, and their trying to emulate it, and our supranational firms enabling the process via massive FDI for 20-30 years, ensures that we will not sustain our living standards hereafter.
I estimate that fewer than 1% of the population understands Jeffrey’s highly informed work, and not many more actually understand “money” and how the banking/financial system works. This lack of understanding of net energy/exergetics and the financial system virtually guarantees that we will continue to act on fallacious/erroneous information with the predictable consequences hereafter.
We’re not “running out of oil” but out of required growth of subsistence employment, domestic revenues, and after-tax and -debt service real incomes, profits, and gov’t receipts at the current price of oil to sustain the necessary growth of overall demand to ensure the necessary profitable investment in domestic energy production of any kind to sustain our living standards.
That economists don’t understand (have no incentive to understand) thermodynamics/exergetics and ecological systems ensures that their assumptions and models will be minimally irrelevent and harmful in the worst case.
BC, you argued:
there is next to no possibility that we can sustain the post-Seneca cliff liquid fossil fuel infrastructure at the current real final sales per capita AND simultaneously build out an electricity-based renewable infrastructure to scale.
That’s highly unrealistic. Liquid fuels just aren’t that necessary: freight uses about 10%. More than 50% is used for relatively low value personal transportation: commuting alone in SUVs, and recreational travel.
The US could reduce it’s liquid fuel consumption in months with aggressive fuel taxes and car-pooling measures. There is an enormous surplus of fuel available: over 50% of US liquid fuel is used to move an average of 1.15 people per vehicle at 23MPG. Raise that to 2.3 people and 30 MPG, and you reduce overall fuel consumption by 30%. Of course, such measures would be inconvenient, but that’s far from falling off a “Seneca cliff”.
2nd, there’s very little liquid fuel used to manufacture vehicles, and not that all that much from other energy sources (mostly electricity, which is abundant), and electric vehicles don’t take more energy to manufacture than ICE vehicles.
Just properly price oil, and consumption would fall far faster than available supplies. And we’d all be more prosperous.
http://in.reuters.com/article/2014/03/26/china-debt-bank-idINDEEA2P02K20140326
China is due an 1890s- or 1930s-like debt-deflationary and banking system collapse, which might be in the process of commencing.
China is a financial black hole for the global financial system. The Asian city-states and the rest of Asia will be sucked into China’s black hole of debt/asset destruction.
Just have Russia’s Govt spend a bunch of money on infrastructure and their central bank buy the bonds with newly created money.
They seem to be clueless that when they start sable rattling about freezing assets as retaliation then they feed right into the old stereotypes of communist Russia. Sort of funny to see then amplify the effects of our sanctions.
Professor Chinn, I love the title to this article.
Nick G: I’d like to emphatically second your comment.
Jeffrey, the presumption must be that most readers, no matter how bright, are laymen relative to your field of expertise. The second presumption is that your reader’s time is valuable. If you want to contribute, the conclusion flows logically that the gist of what you say should be put down in plain language. I appreciate your posts, in good part because they are rarely ideological. And they are meaty. However, I long ago stopped reading them word for word (time too valuable).
It takes extra time for the writer to distill complexity into lay language. Perhaps you put everything in complex form to make the pertinent points. And then add a lay summary. It is simply not so that extra words are always superfluous. Those extra words – your crisp summary – often nail it. The reader does not have to go back.
Check out the Art of Plain Talk by Rudolf Flesch (1946). It will be one of the best investments you ever made. I still have my handwritten notes – three 8½ by 11 pages – from 1980.
Suppose 100 people read your comment. And suppose you save each an average of 6 minutes time. That’s 10 hours. Well worth the extra 10 or 15 minutes it takes you. Out of courtesy for others. And out of getting your point across. You do not have to dumb down your vocabulary. Quite the contrary, you want to use the most apt, descriptive words possible. They can look up abecedarian if they don’t what it means.
The economy is the most complex subject known to man. How much more so does the above apply to economists? In peer-reviewed work, and even more so in what’s presented to the public.
Jim Kunstler has made similar comments about my work (using far more colorful language), but as noted above, it’s difficult to explain multiple exponential functions, and then we have the Upton Sinclair quote, about the difficulty of getting someone to understand a concept when their job depends on them not understanding it. But for anyone who wants to continue on, here is an analogy:
The bank balance model
Assume that you deposited $55,000 into a bank account in the year 2000 and then immediately withdrew $10,000. One year later, in 2001, you withdrew $9,000, a year after that you withdrew $8,000, and so on.
Current Balance – Annual Withdrawals = New Balance
2000: $55,000 = $10,000 = $45,000
2001: $45,000 – $9,000 = $36,000
2002: 36,000 – 8,000 = 28,000
2003: 28,000 – 7,000 = 21,000
2004: 21,000 – 6,000 = 15,000
2005: 15,000 – 5,000 = 10,000
2006; 10,000 – 4,000 = 6,000
2007: 6,000 – 3,000 = 3,000
2008: 3,000 – 2,000 = 1,000
2009: 1,000 – 1,000 = Zero
The bank balance at the end of 2000 was $45,000. The observed exponential rate of decline in withdrawals from 2000 to 2005 was 14%/year (from $10,000/year to $5,000/year). However, the rate of depletion in the post-2000 bank balance was 30%/year, as the bank balance fell from $45,000 at the end of 2000 to $10,000 at the end of 2005.
The annual withdrawal rate is analogous to annual net exports and the post-2000 bank balance would be analogous to the remaining supply of cumulative net oil exports (CNE), from a net oil exporting country.
My little mathematical model, what I called the Export Land Model (ELM), assumed a production peak in the year 2000, with a production rate of 2.0 mbpd, with a 5%/year rate of decline in production and a 2.5%/year rate of increase in consumption, with an ECI Ratio (ratio of production to consumption) of 2.0. In other words, in the year 2000, the region consumed half of production. In any case, the ELM showed that net exports fell from 1.0 mbpd in 2000 to 0.41 mbpd in 2005, a rate of decline of 18%/year. This is analogous to the rate of decline in withdrawals for the bank balance model. However, the remaining supply of post-2000 CNE from Export Land fell from 1,382 mb at the end of 2000 to 220 mb at the end of 2005, a 28%/year rate of depletion. This is analogous to the rate of depletion in the bank balance model.
If we look at some real world data, for the Six Country Case History, the 1995 to 2000 rate of decline in net exports was 4.7%/year, but the 1995 to 2000 rate of depletion in post-1995 CNE from the Six Countries was 21%/year.
I am using what I call to Export Capacity Index (ECI), or ratio of production to consumption, to simplify the relationship between rates of change in production and consumption. In any case, the above referenced time periods for the Export Land Model and the Six Country Case History corresponded to substantial declines in their ECI Ratios. We have seen similar post-2005 declines in the ECI ratios for Saudi Arabia and the (2005) Top 33 Net Oil Exporters, as we have seen post-2005 declines in Saudi and Top 33 net exports.
Does that mean that we have seen similar high rates of depletion in the remaining supplies of post-2005 Saudi and Global Cumulative Net Exports of oil?
The basic problem is that I don’t think that there is an easy way to explain these concepts, but the larger problem is that almost everyone who does understand the math is in some stage of denial. Almost no one is in the acceptance stage regarding what I call “Net Export Math.”
Jeffrey,
It shouldn’t be hard to write an easy-to-understand summary explanation:
The difference between production and consumption is the surplus available to export to other countries. If oil exporters keep domestic prices artificially low with price controls and subsidies, their consumption of oil will grow quickly. If their oil production is falling at the same time that consumption is rising, their exports will disappear very quickly.
That’s a good first draft.
There’s a fascinating bit of information hidden in Jeffrey’s data:
Russia is *not* increasing the percentage of their oil production that they use for domestic consumption or value-added manufacturing. If they were sensible, they wouldn’t just provide raw commodities for other countries. Instead, they’d move into value-added products, like plastics/petrochemicals, fertilizer, or just simple refined products like deisel.
This is a sign that Russia is stagnating, and not diversifying from their historic role as a quasi-3rd world raw materials exporter.
When oil prices drop (which they will, *someday*), due to competition, recession or movement to alternatives (which is most likely), Russia will be in serious trouble.
Nick, this is why the middle east is building up these financial centers and new cities. people around the world question the motives, but they at least are trying to put oil money to future productive means, rather than simply lining the pockets today. someday they understand their valuable commodity will cease to be so.
However, population growth rate with dramatically increasing domestic demand in combination with political instabilities are a claer disadvantage of the Middle East states like Saui Arabia.
IMHO Russia has much better chances to perform the transition from a commodity exporter to a modern economy than many of the ME countries. Well trained workforce and an real industrial tradition are a clear plus.
Seems as if the Russians very quickly added significant “capital investment” in the form of the Crimea and hardly spent anything getting it. They also added significant natural resources and 50 or so naval vessels with very little effort. Who says conquest is bad economics?
Bruce,
There’s a key principle for investing, or acquiring “stuff”. It’s often neglected. It is that capital equipment/stuff requires feeding. It’s a living thing that requires all sorts of maintenance and operational expense, so there better be a serious value or ROI.
As best I can tell, Crimea will require lots of subsidies from Russia, and lose them enormous goodwill from neighbors & business partners. Sure, there’s oil & gas and a naval base, but it looks to me like mostly national pride – they accidentally lost Crimea in the breakup of the USSR, and now they want it back.
Kind’ve expensive…
Yeah, the British Empire, the Roman Empire, and all of the other expansionist empires were examples of how “expensive” it was to acquire geography and assets through military force. 😉 I’d say it was more expensive to be taken over than to take over. Eventually, after several hundred years, empires fall apart and new ones arise, but until the crumbling occurs, the ride is pretty good.
That seems mighty oversimplified. The British Empire took place during a period of actual economic expansion, while the Roman Empire appears to have a been a zero-sum Ponzi scheme. AFAIK, the average Roman imperial subject was better off without the empire.
Russia’s empire has *already* crumbled. This appears to be fighting over not very attractive crumbs.
Well, having military assets is not perhaps the most profitable thing to have – you cannot really produce much useful stuff with guns and warships…..
This is another reminder that America’s energy policy has really become a crime at this point. How could anyone argue against a revenue neutral, but gigantic carbon tax (at least for consumers) and simultaneous wage tax cut at this point? Now we have almost too many reasons to do this… I wonder how much a $2.00 per gallon tax on gasoline in the US (and similar tax on gas) would sink oil prices?
Absolutely.
Given the enormous external costs of oil (pollution, war, political corruption, etc), it should be higher than that – probably $5/gallon, which would bring US prices in line with Europe.
Also, it should absolutely apply to industrial/commercial fuel, such as diesel. Europe is in trouble in part because they only tax consumer fuel, leading to many distortions like overuse of diesel for consumers, and overuse of trucking for freight.
Yeah, the British Empire, the Roman Empire, and all of the other expansionist empires were examples of how “expensive” it was to acquire geography and assets through military force.
In fact, it was expensive for them. In the case of the Romans, most of their empire cost more to occupy than returned in taxes. The same can be said the British – post WW2 analysis indicated that the bulk of the empire was an economic drain, outside of India, and once they lost that, well, not much reason to hold onto the rest.
Military conquest is more like bank robbing, than profitable takeovers – which is, simply, the point that Nick G. was making earlier.
As for empires lasting so long; any sufficiently large enough enterprise can run red ink for a long, long time, if there isn’t any serious competition around.
Professor “Veblen”, an energy tax in lieu of corporate (especially small business) or labor taxes of any kind is preferable, as is your contemporary Henry George’s (largely unknown) “single tax” on the land resource and place-value rents accruing in perpetuity to the rentier caste, including banksters, to the monopoly control of debt-money creation and “enclosure-like” nature of mortgage (“dead pledge”) servitude in perpetuity.
A tax on leveraged rentier financial asset speculation is also necessary to discourage, no, to prohibit, hoarding of no-velocity financial assets by the rentier elite top 0.01-0.1% to 1%, starving the productive sectors of necessary low-cost (non-inflationary) credit for investment and production at labor returns vs. unsustainable speculative rentier returns of 7-10%+, encouraged by fraudulent fractional reserve banking and the gov’t-sponsored license to steal labor product, profits, and gov’t receipts via compounding interest claims in perpetuity.
BC Methinks they do not get it. And that they are never going to.
I think some European countries are looking with dismay at the people (certain U.S. officials) who seem intent on cutting off the branch on which they are perched. To my mind, the bigger question is not whether Russia will be sufficiently punished by planned economic sanctions, but whether the cost to the rest of the world is worth it. Being an economist, I am too frequently dismayed by the ignorance of nonprofessionals who decide to opine on economic questions, so I will admit to feeling uncertain about questions of international diplomacy. On the other hand, the ‘professionals’ seem to have taken us on some rather ill advised ventures in the past (Bay of Pigs, Vietnam, support for dictatorships (such as the Shah of Iran) against perceived threat from communist elements, whether or not democratically elected, to name a few. That said, It is far from clear to me that there are good arguments for the position that Ukraine should keep Crimea.
It is far from clear to me that there are good arguments for the position that Ukraine should keep Crimea.
That’s a very different question than a real-politik cost/benefit analysis of sanctions. The rule of law says it’s not ok for countries to grab portions of their neighbors, even if they previously lost those areas “by accident”. There’s a real value to upholding the rule of law. Heck, strict application of the rule of law would have prevented the ill-advised adventures you mention, as well as the US’s invasion of Iraq…
Don,
one aspect of the events that led to the reunification of Germany in 1990 was an unspoken agreement to maintain a buffer between Russia and Nato. The last year we saw a lot actions which eroded this glacis. As a result, Russia now chose a solution that was in their eyes the lesser of two evils: The part, that was from a military point of view highly valuable was occupied. BTW this was easy because the Krim was only added to Ukraine after WWII for administrative purpose.
As fan of Realpolitik I would say the western countries share half of the responsibility for the current mess. The interesting question for me is why was it done? A better strategy – considering the soft power of the EU – would have been to let the whole Ukraine in the Russian sphere of influence and let Russia fight in the next decades an uphill battle.