How has the world managed to increase both population and living standards on a finite planet?
A key feature of raw commodities is that they are ultimately produced from a finite resource base. The classic example is agricultural products, which require land to grow. As we try to produce more and more crops on a finite number of acres, the familiar economic theory of diminishing returns suggests that the marginal cost of food production should increase over time. This basic calculus led Thomas Malthus two centuries ago to predict that, if population growth was not held in check, the world’s masses were headed for a future of starvation and misery.
That didn’t happen, and the reason was technological progress and use of machines. As we discover better ways to grow crops, that can be a factor reducing marginal cost. Which of these two competing forces ends up dominating– diminishing returns or technological progress– is ultimately an empirical question.
A recent paper by Hiroshi Yamada and Gawon Yoon (2014) revisits this question, looking at the behavior of relative prices of a number of commodities over the last century. Rather than insist that one influence (technology or diminishing returns) dominates over the entire sample, the authors used a method that allows the possibility that different broad trends may characterize different subsamples.
The graph below displays their results for a number of agricultural commodities. The blue lines record the price of the indicated commodity relative to the price of manufactured goods. The relative price is measured on a natural log scale, so that a vertical move of 0.1 roughly corresponds to a 10% increase or decrease. Huge changes are often observed over a short period of time. The red lines indicate the authors’ measures of broad trends in the real prices of the different commodities.
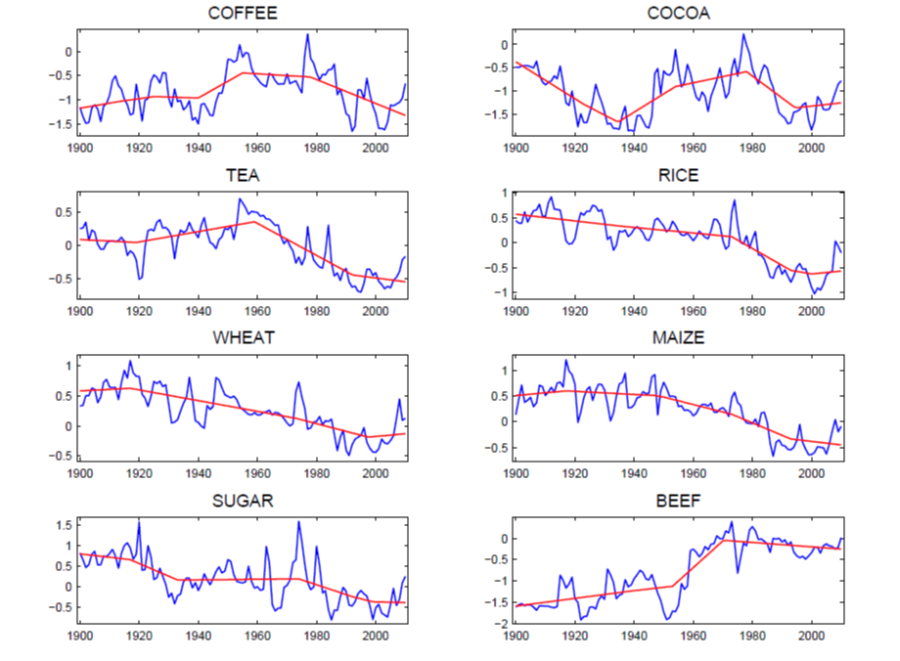
Blue: natural log of commodity price divided by manufacturing unit value index (measure of export prices of manufactured goods for G5 countries). Red: intermediate trend lines. Source: Yamada and Yoon (2014)
Relative prices of most agricultural commodities rose sharply over the last decade, as growing incomes in the emerging economies led to increased demand. That pushed prices up (the blue lines) as a result of the diminishing-returns effect described above. But it is interesting that the Yamada-Yoon red trend lines typically dismiss the dramatic price increases over the last decade as a temporary blip up within the context of a longer-run trend of stable or declining relative prices.
The technological advances that led to the broad trend of falling real food prices often seen in the graphs above are well understood. The Green Revolution– improvements in irrigation, fertilizer, pesticides, and hybridization– managed to keep significantly ahead of Malthus’s diminishing returns.
And technological progress in agriculture continues at an amazing pace. Advances in genetic engineering and precision agriculture based on geographic information systems, global position systems, remote sensing, and variable-rate technology are developing new ways to get more out of every acre of farmland. One could make a case that Yamada and Yoon’s statistical trend lines, which see the world as still in the midst of a broad downward trend in the relative price of many agricultural products, will turn out to be a correct prediction of what we’ll see over the next decade.
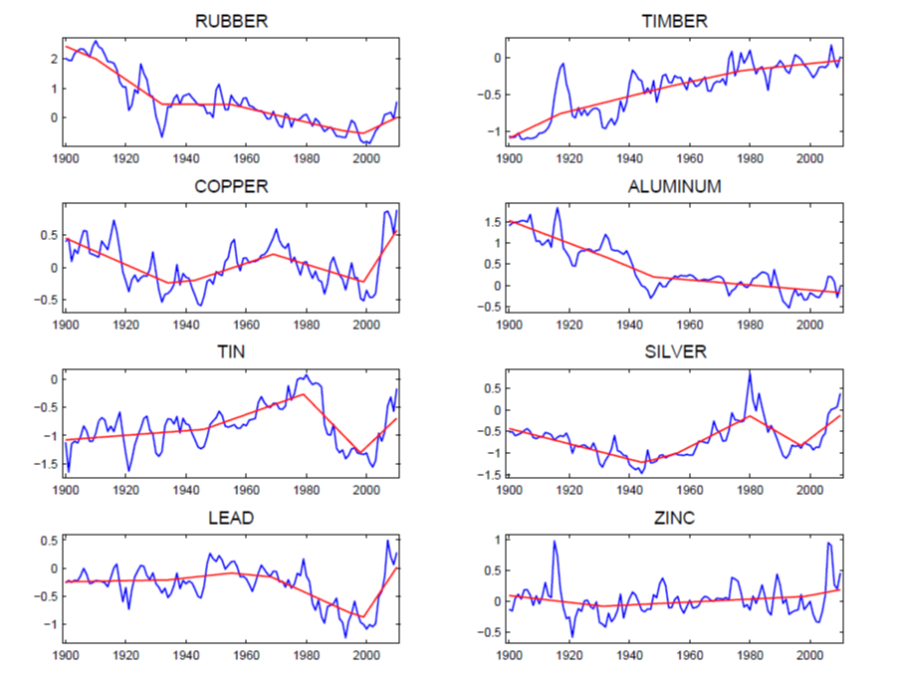
In the case of commodities that are produced from mines under the ground, Malthus’s principle of diminishing returns could take an even bigger bite. Typically the easiest-to-produce ores (that is, those associated with the lowest marginal cost) would be mined first, leading us to anticipate that, even to produce the same number of tons (let alone an increasing quantity) of the resource each year, we would face an increasing marginal cost over time. The graphs below include a number of extractive commodities. Aluminum prices show an even more convincing downward trend than most agricultural commodities– for this commodity again technological advances appear to have kept ahead of depleted mines and growing demands for over a century. But for other goods, such as copper, tin, and lead, it’s more difficult to dismiss the price surge over the last decade as a temporary anomaly.
The graph below displays the real price of crude petroleum since 1870. For the first century of the industry, the long-run trend was unmistakably down, with technological advances keeping ahead of growing demand and depleting reservoirs. The price shot dramatically up during the temporary supply disruptions associated with the OAPEC oil embargo of 1973, Iranian revolution in 1978-79, and Iran-Iraq War beginning in 1980. The price subsequently plunged, though it remained well above the average value seen in most of the earlier twentieth century. The price of oil spiked back up pretty dramatically over the last decade.
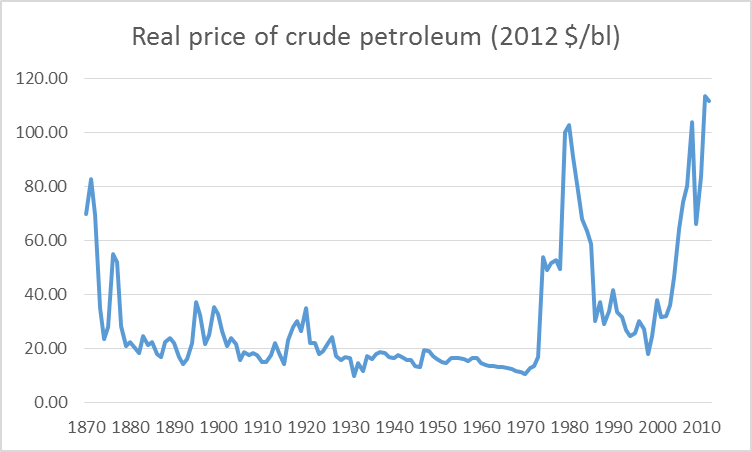
Price of a barrel of oil measured in 2012 dollars, 1870-2012. Data source: BP Statistical Review of Energy.
In a recent analysis written for the Handbook of Energy and Climate Change I looked into the details behind the advances in oil production that account for the broad downward trend in the real price of oil over the first century of the industry. I concluded that a primary driver of growing production was moving on to new oil fields rather than improving technology for getting more oil out of older fields. The graph below shows that oil production from Pennsylvania (where the industry began) peaked in 1891, a reality that none of the remarkable technological advances of the following century would ever change. Total U.S. production continued to grow, despite falling output from Pennsylvania, because we moved on to other states like Ohio, West Virginia, and Illinois. Their oil production peaked in 1896, 1900, and 1940, respectively. Each individual state eventually faced diminishing returns and falling production, but total U.S. production nonetheless continued to grow, because for a while there were always new states and new oil fields to which we could turn.

Production of oil (in thousands of barrels per year) for selected U.S. states, 1859-2013. Source: updated from Hamilton (2013).
U.S. production continued to climb (and marginal costs continued to fall) as the industry moved into oil fields with much more potential than those in the states where the industry began. The black liquid that initially came gushing out when you drilled into the ground in Texas is the most important example. But each U.S. state (other than North Dakota– more on that below) eventually reached its peak and then began a decline, with total U.S. oil production peaking in 1970.

Production of oil (in millions of barrels per day) from all U.S. states combined, 1859-2013. Source: updated from Hamilton (2013).
U.S. field production has been climbing back up since 2008, thanks to new methods for getting oil out of tight geologic formations by horizontal fracturing of the rock. It is important to note that these methods are not a technological advance like those mentioned for agriculture that allowed us to produce more of the product at a lower marginal cost than previously. Indeed, fracking would not be profitable at the prices paid for oil over most of the first century and a half of the industry. I think the correct way to view shale oil production is as a specific mechanism by which the industry has figured out how to maintain production in the face of a depleting resource base by moving along an upward-sloping marginal cost curve.
It’s also worth noting that more than 100% of the increase in global crude oil production since 2005 has come from U.S. shale oil. Without it, global field production would be lower today than it was in 2005. The U.S. Energy Information Administration had been expecting U.S. shale oil production to peak around 2021. Last week Reuters reported that the EIA has cut its estimates of recoverable oil from California’s Monterey Shale by 96%.
There is no question that the relative price of any commodity is subject to competing long-run pulls from increasing marginal cost on the one hand and improving technology on the other. Many people seem to just pick one or the other factor as a one-size-fits-all sweeping generalization for all commodities and all time. But a little reflection and inspection of the data should convince an objective observer that the broad trends appear to be different for different commodities and at different points in history. A careful look at the historical record leads one to reject both unbounded optimism in the potential of technology as well as unrelenting pessimism about Malthusian dynamics as universal truths.
But then there is the question of net exports, especially of food and and energy. I assume that economics professionals would agree with the two following statements:
(1) Price is a function of supply & demand;
(2) A net exporter can only net export what they don’t consume.
My hobby for a few years has been researching and writing about what I call “Net Export Math,” especially in regard to net oil exports. It’s really a set of mathematical observations, to-wit, which I called the “Export Land Model” or ELM:
Given an ongoing production decline in a net oil exporting country, unless they cut their consumption at the same rate as the rate of decline in production, or at a faster rate, the resulting net export decline rate will exceed the production decline rate, and the net export decline rate will accelerate with time. Furthermore, a net exporter can become a net importer prior to a production peak, if the rate of increase in consumption exceeds the rate of increase in production, e.g., the US & China.
Indonesia and the UK are two interesting case histories. Indonesia maintained petroleum consumption subsidies all the way down to net importer status, while the UK heavily taxed petroleum consumption.
Indonesia’s production (total petroleum liquids, BP) fell by 23% from 1991 to 2002, while consumption increased by 70%, which resulted in a 90% decline in net exports (they became a net importer in 2003).
The UK’s production fell by 38% from 1999 to 2005, while consumption was basically flat (up only 4% in six year), which resulted in a 100% reduction in net exports (the UK was a net importer in 2006).
A corollary to the ELM is that the bulk of post-export peak Cumulative Net Exports (CNE) are shipped early in the decline phase. What I call the Six Country Case History consists of the major net oil exporters that hit or approached zero net oil exports from 1980 to 2010, excluding China (Indonesia, UK, Egypt, Vietnam, Argentina, Malaysia). Following is a chart showing normalized production, net exports, ECI Ratio (ratio of production to consumption) and remaining post-1995 CNE by year (1995 values = 100%) for the Six Country Case History. Note that as their combined production rose by 2% from 1995 to 1999, they had already shipped 54% of post-1995 CNE:
http://i1095.photobucket.com/albums/i475/westexas/Slide2_zps6c3a6280.jpg
Based on the seven year 1995 to 2002 rate of decline in the Six Country ECI Ratio, estimated post-1995 CNE were 9.0 Gb (billion barrels). Actual post-1995 CNE were 7.3 Gb.
Following is a chart showing normalized production, net exports, ECI Ratio (ratio of production to consumption) and estimated remaining post-2005 CNE by year (2005 values = 100%) for the (2005) Top 33 net oil exporters:
http://i1095.photobucket.com/albums/i475/westexas/Slide3_zpse00789d2.jpg
Based on the seven year 2005 to 2012 rate of decline in the (2005) Top 33 ECI Ratio, I estimate that we have already (through 2012) burned through about one-fifth of the combined post-2005 Cumulative Net Exports of oil from the (2005) Top 33 net exporters, what I call Global Net Exports of oil (GNE). As noted above, this method of estimating Cumulative Net Exports of oil was too optimistic for the Six Country Case History.
For more info on Net Export Math, you can search for: Export Capacity Index.
From “A Christmas Carol in Prose, Being a Ghost Story of Christmas,”
Then there is the “Chindia Factor.” Following is a chart showing normalized liquids consumption for China, India, (2005) Top 33 Net Oil Exporters and the US, from 2002 to 2012 (2002 values = 100%), versus annual Brent crude oil prices.
On the following chart, note the divergent responses to the post-2005 increase in Brent crude oil prices for “Chindia” and the Top 33 exporters versus the US:
http://i1095.photobucket.com/albums/i475/westexas/Slide14_zpsb2fe0f1a.jpg
The $64 Trillion question is what happens in the next 10 to 20 years. At the 2005 to 2012 rate of decline in the ratio of Global Net Exports of oil (GNE*) to the Chindia region’s net imports (CNI), the GNE/CNI Ratio would be at 1.0 in the year 2030, 16 years hence, which would theoretically leave zero net exports of oil available to net oil importers other than China & India:
http://i1095.photobucket.com/albums/i475/westexas/Slide1_zps9ff3e76d.jpg
EIA: U.S. petroleum product exports to Mexico rise while Mexican crude exports to the U.S. fall
http://www.eia.gov/todayinenergy/detail.cfm?id=16451
My comments:
Mexico’s net exports fell from 1.8 mbpd in 2004 to 0.7 mbpd in 2012 (total petroleum liquids + other liquids, EIA).
At the 2004 to 2012 rate of decline in what I call the ECI Ratio (ratio of production to consumption), Mexico would approach zero net exports around the year 2020.
A 24% decline in production from 2004 to 2012, plus a slight increase in consumption, resulted in a 61% decline in net exports. Yet another example of “Net Export Math.”
Nice post.
I would say that the outlook for oil production is the most negative in the last three or four years.
I would highlight Saudi Arabia. Aramco intends to spend $25 bn drilling (or possibly in broader development) of a giant gas field in the Red Sea in 1,000 meters of water. Such a gas development in the US would be uneconomic.
It is it clear why Saudi would not just export a bit more oil to buy necessary gas from another provider in the region, Qatar, for example.
One interpretation of Saudi plans is that oil at the margin is now costing the Saudis as much as it does the IOCs, who are also dependent on the economics of deep water.
The Saudis are burning oil for power, so more gas production could substitute for oil. That makes additional local gas production as valuable as oil.
The Saudis try to encourage local industry by keeping NG prices way too low – that has suppressed production up to this point.
Normalized production, net exports, ECI Ratio and Estimated remaining post-2005 CNE by year for Saudi Arabia (2005 values = 100%):
http://i1095.photobucket.com/albums/i475/westexas/Slide21_zpsd1963fe3.jpg
ECI Ratio = Ratio of production to consumption
CNE = Cumulative Net Exports
2002 to 2012 ECI values for Saudi Arabia (extrapolation based on 2005 to 2012 rate of decline):
http://i1095.photobucket.com/albums/i475/westexas/Slide10_zpse47cfe8a.jpg
WSJ: IEA Expects World to Rely More on Middle East Oil
http://peakoil.com/consumption/iea-expects-world-to-rely-more-on-middle-east-oil
“…not clear why…”
Advances in genetic engineering and precision agriculture based on geographic information systems, global position systems, remote sensing, and variable-rate technology are developing new ways to get more out of every acre of farmland.
And then you have to fight Mother Nature as well as Malthus. Two quick examples. First, one of the reasons John Deere has seen big profits in the last couple of years is that farmers are once again relying upon plows to control weeds. Ten years ago no one was buying plows. Instead, farmers relied upon Roundup herbicide, which allowed low till/no till farming. During those years top soil erosion had just about stabilized. But a few years ago we started getting superweeds. Erosion is once again a significant farm issue. The second example concerns genetically engineered crops to combat higher temperatures as a result of climate change. Setting aside the question of whether or not farmers will be able to convince consumers that genetically engineered foods are safe, there is the entirely separate issue of having to convince farmers that planting those crops would be economical. By the nature of the industry farmers are forced to be quite short term in their thinking. Planting heat tolerant varieties of corn and soybeans is a gamble because the yields are significantly lower unless you actually experience a very hot growing season. The problem is that annual variation in weather is greater than the much slower change brought about by climate change. Farmers do not have an economic incentive to plant heat tolerant crops because the expected yield for any given year will be lower. In this paper the authors found that even though yields have increased since 1950, there is no evidence that greater use of heat tolerant varieties has contributed to that growth. Moreover, there are very powerful economic forces that make it very unlikely farmers will adjust to heat tolerant crops without some kind of subsidy.
http://www.nber.org/papers/w16308
John Deere is a massive company and plows are likely a tiny portion of their total sales
Open to persuasion but I very much doubt the presence of roundup resistant weeds had a measurable impact on either sales volume of plows or john deere profitability.
Regarding the NBER paper.
If heat stress becomes an issue farmers will pay for heat resistant varieties, without a subsidy, because non heat stress resistant plants will not grow. That is unless the insurance payments are worth more than the crop, but that would be a policy issue not an agronomic one.
From page six of the paper
Water is the 800 pound gorilla in crop production and the paper says that crop varieties that tolerate lower moisture levels are being produced.
And a confounding factor is introduced by the fact that heat and drought tolerance are interrelated.
The quote you cited: “At the same time, heat tolerance and drought tolerance are inherently intermingled because water requirements increase with temperature..” is an additional factor beyond just the heat effects themselves. What you omitted was the important quote from the previous paragraph that said: “greater heat tolerance comes partially at the expense of reduced yield potential. Wahid et al. (2007) emphasis that “acquiring thermotolerance is an active process by which amounts of plant resources are diverted to structural and functional maintenance to escape damages caused by heat stress.” Presumably, those resources would otherwise go into seed formation and greater yields in the event of less extreme weather.” In other words, heat is a problem for two reasons. First, because it drains plants of resources needed to produce yields. But a secondary reason is the confounding relationship between heat and water.
As to the need for subsidies, here’s what the paper says: “The economic rationale for a public role in basic research is that there are positive
spillovers from the spread of ideas, so private companies do not necessarily have the right incentives to breed the most socially beneficial crops, as they cannot reap all the benefits.” If you look at data from this and other papers you will find that because of the asymmetry in the yields of heat resistant crops, and because farmers are forced to look over the very short run, the best bet in any given year is to not plant heat resistant crops. In other words, farmers have an economic incentive to stick with the same-old-same-old. As this paper and others have found, there is simply no evidence that farmers have been willing to gamble on heat resistant crops.
As to John Deere’s profits, I think you may have misunderstood my point. I’m sure that John Deere would do just fine without sales of plows. OTOH, plows are something that were not big sales drivers 10 years ago. Today they are. My larger point was that superweeds have developed resistance to the usual herbicides that allowed for no till/low till farming. So farmers have returned to deep plowing in a big way. Soil erosion was one of those problems that we thought we had more or less contained to a permanently sustainable level. That’s not true anymore.
Slugs, also consider what the “cides” are likely doing to the bee populations on which the ag sector depends for pollination.
http://robobees.seas.harvard.edu/
https://www.youtube.com/watch?v=VxSs1kGZQqc
https://www.youtube.com/watch?v=XgWIxL6b0w4
But now scientists and engineers are developing micro- or nano-“drones” or “robo-bees” for pollination to replace the bees our friends at Monsanto and Dow cause to go extinct.
Technology is the answer, until it’s not. Then technology is the answer, again, until it’s not.
Interesting but I’m skeptical of the deflator, especially before 1960. It’s a nice idea to compare commodity prices to manufactured good prices over time, but the meaning of “manufactured goods” changes radically over periods of decades.
Looking under the hood, this data is actually from Stephan Pfaffenzeller
(http://www.stephan-pfaffenzeller.com/cpi.html) who is extending similar series by Grilli and Yang. If I understand right, the manufactures price data comes from the World Bank’s MUV index (a composite index of G-5 manufactures export prices) back to its start in 1960 and a mix of US manufactured goods producer price data and “interpolated” data whatever that means for earlier years.
One could instead compare commodity prices to incomes, though then you’d get wildly differing results with developed, developing or global incomes.
PS I don’t see any objective reason why the recent upswings of blue lines should be so frequently dismissed by the red lines. That seems to be arbitrary author decision.
Tom: The red lines represent the outcome of a formal statistical inference driven solely by the data and not by the authors’ opinions, as you’ll see if you follow the link to the original paper.
Yes, sorry if I was unclear, the arbitrary author choice is the trend mapping method and calibration. Mapping trends at the ends of series is inherently more arbitrary than mapping trends in the middles of series. What I mean is there’s nothing inherent in the commodity price data that tells us that the upward price swings in most commodities since 2003 wasn’t a break in trend. I’m convinced it was a break in trend.
Perhaps, sometime in the 21st century, world population will stabilize, while technological progress to extract metals continues. Eventually, there may be recycling of metals.
The U.S. is abundant in natural gas and coal, and oil production has increased recently through technology, rather than more drilling in Alaska, California, the Gulf of Mexico, etc..
Efficiency and alternative energy will provide almost infinite energy sources.
Also, I may add, exporting natural gas seems to be very inefficient. There are three unusual factors about natural gas:
1. The price differences are huge, e.g. more than twice as high in Europe and more than three times higher in Japan.
2. It has to be converted into liquefied natural gas for export, which seems to be expensive.
3. It’s a “residual good” for many oil producers, which implies supply is relatively inelastic, i.e. a higher price may not increase supply much.
****
“Costs of liquefaction can range from $1.50 to $2.00 per mcf…Shipping costs can vary from $0.30 to $0.90 per mcf.
Regasification…converting LNG from a liquid back to a gas so that it can be moved through the domestic natural gas pipeline transportation network…can add $0.30 per mcf to the cost of LNG. Thermal energy (heat) is required to regasify the LNG.
Total costs of liquefaction, shipping and regasification could add up to $2.10 per mcf on the low end to $3.20 per mcf on the high end. Add to this the base cost of the natural gas commodity, currently around $3.00 per mcf in the US. Bringing the total cost of delivering US produced LNG to Europe or Asia to $5.00 to $6.00 per mcf.
To put this in perspective, natural gas in the UK is currently trading around $8.00 per mcf and in excess of $15.00 per mcf in Japan.”
http://extension.psu.edu/natural-resources/natural-gas/news/2012/02/understanding-the-role-of-liquefied-natural-gas-part-1
Natgas in US trades at $4.5 because of a very cold winter. If we have a warm winter, ends up at closer to $3.5, maybe lower. So even with shipping costs, US Natgas is $8.5 to $10.5 mcf, so makes sense to ship to Asia.
What about the $2.10 to $3.20 per mcf for liquefaction, shipping and regasification?
Does that generally increase or decrease living standards?
And, it makes sense to U.S. producers and Asian consumers.
What about U.S. consumers and Asian producers?
Gap is much bigger than $2.1 to $3.2, so makes sense for companies doing it.
If you believe in free trade, makes sense for everyone. US produces more natgas, which they can in what seems now unlimited amounts, and Asia get more natgas which allows them use for power instead of coal and get better air to breath. More US job in energy industry.
So I would argue increases everyone’s living standards, just like free trade should.
You write, The technological advances that led to the broad trend of falling real food prices often seen in the graphs above are well understood. The Green Revolution, improvements in irrigation, fertilizer, pesticides, and hybridization, managed to keep significantly ahead of Malthus’s diminishing returns.One could make a case that Yamada and Yoon’s statistical trend lines, which see the world as still in the midst of a broad downward trend in the relative price of many agricultural products, will turn out to be a correct prediction of what we’ll see over the next decade
I respond that the falling real food prices will increase, as the World’s Major Currencies, DBV, and Emerging Market Currency Prices, CEW, started to decline in May 2014, and it will take more of these to buy Agricultural Commodities, RJA, which are priced in US Dollars.
You continue, The graphs below include a number of extractive commodities; for copper, tin, and lead, it’s more difficult to dismiss the price surge over the last decade as a temporary anomaly.
I respond that the price of Copper, JJC, has been inflated by liberal PBOC credit liquidity policies, by the China Shadow Banking practice of stockpiling copper as collateral for loans, and by ever increasing currency carry trades such as the EUR/JPY, until January 14, 2014, when it started to deflate.
You conclude, There is no question that the relative price of any commodity is subject to competing long-run pulls from increasing marginal cost on the one hand and improving technology on the other.
I respond please consider that the relative price of commodities, especially agricultural commodities, is going to soar, as investors derisk out of debt trade investments and currency carry trade investments, and as authoritarianism’s singular economic dynamo of regionalism increasingly replaces liberalism’s three dynamos of creditism, corporatism and globalism.
Out of a soon coming global credit bust and financial system breakdown known as Financial Apocalypse, seen in Revelation 13:3-4, the world will no longer operate on Major World Currencies, DBV, such as the Euro, FXE, and Emerging Market Currencies, CEW, such as the Brazilian Real, BZF, but rather on the Beast Regime’s dikat money, that is the mandates of sovereign regional leaders for regional security, stability and sustainability.
A new price system will emerge; it will neither be a fixed price system where prices are set by the government, nor will it be free price system; the new normal price system will be the beastly price system, which operates on diktat money.
The Rider on the Black Horse, seen in Revelation 6:5-6, will introduce famine replacing surplus, and the Rider on the Ashen Horse, seen in Revelation 6:7-8, will introduce economic deflation replacing economic inflation, and the result is economic death replaces economic life. Wikipedia relates “The fourth and final horseman is named Death. Known as “the pale rider”, of all the riders, he is the only one to whom the text itself explicitly gives a name. Unlike the other three, he is not described carrying a weapon or other object, instead he is followed by Hades (the resting place of the dead). However, illustrations commonly depict him carrying a scythe (like the Grim Reaper), sword or other implement.
Perhaps one might enjoy my article Commodities Pivot Lower On Falling Currencies …. As The Banker Regime Produces Peak Money And Peak Wealth
http://tinyurl.com/nhylkbl
Well, personally I thought that the Texas Rangers making it to the World Series was a possible sign of the Apocalypse. Perhaps the world was saved because Nelson Cruz didn’t make a catch to win the series in Game Six of the 2011 Series, thus bringing about the end of the world, but I could be wrong.
I also question the deflator. Growing up in 60s and 70s in an upper middle class family, the choice of whats for dinner was an important economic one, leftovers were rare and the portion size of boys was often limited. Outside of US, millions were starving in China and India.
Yet price of corn, wheat and rice have barely declined and that of beef has increased. These stats are so contrary to reality I think they should be taken with large grain of salt.
Don’t forget these are log charts. If the price goes from .5 to minus .5, it’s ending price is about 1/3 what it was at the beginning. Plus, these charts are comparing the price to manufactured goods. If the price of manufactured goods fell by 50%, then the price of the commodity is only 1/6 of where it started!
@Michael: The price of corn and wheat hasn’t gone down more dramatically on those charts partly because they’re showing prices as compared to manufactured goods, whose prices also went down a lot over the 80s and 90s.
At the low in 2008, US oil extraction per capita at fallen to the approximate systemic collapse level of a decline of 72% from the peak in 1970. Since then, the US has more doubled extraction, which, as pointed out, is primarily from shale.
However, the doubling of extraction has recovered a little more than 40% of the decline per capita from 1970. More importantly, during the same period the US has extracted 40% of proved reserves at an average price above $80/bbl.
At the current rates of extraction, consumption, exports, and reserves, the US will have extracted more than 50% of domestic proved reserves by no later than 2017-19.
What is likely to happen before that? Business and household income and investment and spending will contract yoy in real terms after taxes and debt service, even as investment/production/extraction in the energy sector could continue to grow, albeit at a much slower rate at at slow or no growth of profits until investment and extraction can no longer be sustained at current levels.
https://app.box.com/s/i5e769dr18htyqiln9a3
https://app.box.com/s/bvt8jyj1qp1wmxpeg8am
https://app.box.com/s/sh73qoy9uar2aoeoz7ur
The data are unambiguous: US industrial production ex mining and oil and gas extraction has been in deep secular contraction since 2008-09. ZIRP and over $3 trillion in central bank reserve credit has resulted in $100 oil under the condition of Peak Oil and a doubling of US costlier, low-quality “oil” extraction that otherwise would not have occurred.
Were the oil and gas sectors to be growing at the rate of overall final sales and private investment, the reported real GDP would still be in contraction.
The doubling of extraction of more than 40% of US proved reserves at $80-$100/bbl, projecting half or more of reserves having been extracted by 2017-19, means less costlier “oil” after 2017-19 at a price we can’t afford to extract profitably and burn to grow real final sales per capita, let alone afford simultaneously to sustain the fossil fuel infrastructure AND build out so-called renewables.
WRT oil supply and growth of supply and real final sales per capita, the rest of the world is now where the US was in the mid- to late 1970s, the point at which the US deindustrialized and financialized the economy, doing so with the luxury of $10-$30 oil thereafter, permitting massive growth of debt to wages and GDP. But the rest of the world is now fully indebted and incapable of growing debt to wages and GDP as the US did beginning in the 1980s with cheap oil and a demographic tailwind.
https://app.box.com/s/qendym296b81lf9er0z4
The post-2007 trend rate of real final sales per capita is 0%, having diverged from the post-2000 rate of now slower than 1%.
Thus, Peak Oil and rapid US reserve depletion means a trend of post-2007 US and world real GDP/final sales per capita of around 0% hereafter.
Economists are likely to be surprised by the rate of deceleration of profits, investment, and real household income and spending hereafter. However, the economy will only be normalizing at the secular (permanent) demand constraint being determined by Peak Oil, peak Boomer demographic drag effects, and the emerging mega-drought in the US that will become a hard constraint on further growth of oil and gas extraction in the years ahead.
The higher bubbly asset prices rise as a share of wages and GDP, and the longer the price of oil remains at or above $40-$100, the larger the rentier claim and energy claim on after-tax profits and wages, and on gov’t receipts hereafter indefinitely, and the slower growth of real final sales per capita and gov’t receipts will be.
Even with higher oil prices (and lower natural gas prices), the U.S. economy has the capacity to produce about $1 trillion a year more output.
I stated before:
This deep depression is completely unnecessary. There are excessive federal, state, and local taxes, fees, fines, fares, tolls, etc., both progressive and regressive, particularly for high-income workers, who tend to start businesses.
There are more burdensome and expensive regulations on top of excessive regulations, which are generally regressive and the economy has been unable to absorb, slowing growth. Federal regulations alone cost $2 trillion a year, resulting in higher prices and lower real wages, along with more unemployment.
Moreover, Dodd-Frank, in response to the financial crisis, has caused banks to hoard cash and keep it out of circulation.
There are disincentives to work, including endless unemployment benefits, and dinincentives to take risks, e.g. starting a business, to expand the economy.
“New business startups are at the lowest levels in 30 years.”
March 7th, 2012
Non-employer firms [i.e. self-employed] are 80 percent of U.S. businesses, but have much less economic impact, Shane said [Scott Shane, chairman of the economics department and professor of entrepreneurial studies at Case Western Reserve University] . Employer firms account for 97 percent of gross domestic product.
Using data from the Census Bureau and U.S. Small Business Administration, Shane found that the per capita rate of new employer business formation in 2009 (the most recent year available) was 1.32 per thousand people — “an astonishing 51.4 percent of the rate in 1977,” he said. “That is, Americans are starting new businesses with employees at half the rate they did 30 years ago.”
Not only the rate, but the raw numbers have declined, he said. In 1977, SBA figures show, Americans started 563,325 businesses with employees. In 2009, despite an increase in the population, they started 403,765.
http://www.politifact.com/ohio/statements/2012/mar/23/john-boehner/us-house-speaker-john-boehner-says-new-business-st/
Peak, not only is self-employment and small business creation with employees negatively affected by the regulatory regime, the high costs of payroll taxes, disease care (for the sickest 5-10%) insurance for oneself and employees, and peak Boomer demographics are exerting a once-in-history drag on business formations.
And this is occurring with $100-$110 oil, $4 gasoline, industrial production ex mining and oil and gas in deep contraction since 2008, and real final sales per capita trend growth since Peak Oil in 2005-08 of 0%.
And all of this is in the context of high and increasing costs of mature infrastructure in desperate need of maintenance and upgrading but unlikely to occur because of the emergence of the post-2007, post-Peak Oil Age era of real final sales growth of 0%, no net growth of private, full-time employment per capita, real wages per capita at the level of the late 1990s, and capital formation to final sales back to the levels of the early to mid-1990s to mid- to late 1980s.
Not only can we no longer afford to increase real final sales per capita, we can’t afford to maintain the existing public and private oil- and auto-based infrastructure at the current level per capita, let alone built out “renewables”.
we can’t afford to maintain the existing public and private oil- and auto-based infrastructure at the current level per capita, let alone built out “renewables”.
Sure, we can. We just choose not to! Public infrastructure could easily be improved by appropriate government spending, but fiscal “conservatives” are preventing government from spending the necessary money.
Private spending, of course, would be helped if people chose the least expensive vehicles. That’s hybrids and electrics. Sadly, “conservative” media are doing a pretty good job of scaring consumers away from them, pretending that they’re fire hazards, and making fun of people who buy them.
the approximate systemic collapse level of a decline of 72% from the peak in 1970.
I’ve reduced my oil consumption by more than 72% by taking electric trains. My neighbor has reduced his by 90% by driving a Volt. Another has reduced his oil consumption by 100% by driving a Tesla. And yet, collapse is nowhere in sight…
Wrong, Nick. The net exergetic flows per capita required to maintain the fossil fuel-based infrastructure that permits electric trains and EVs is being supported by a frantic Red Queen Race-like attempt to extract as quickly as possible as much lower-quality, costlier “oil” at a price that no longer permits the rest of the industrial sector to grow, nor overall real final sales per capita to accelerate from the 2007-08 level.
The extraction rate to proved reserves, consumption, and exports is such that by 2017-19 the US will have extracted more than 50% of proved reserves, which risks resulting in liquid fuel shortages, and perhaps even shortages of consumer goods before the decade is out.
Costs of energy, utilities, and food will increase as a larger share of the composition of household spending for the bottom 90%+, reducing further, or eliminating altogether, discretionary spending for a large majority of Americans; and especially the inability to afford Volts and Teslas.
The net costs of the fossil fuel civilization precludes further growth of real value-added economic activity per capita, including build out of “renewables” to support electrified transport.
Once the bubbly housing market again rolls over and contracts, which appears to be imminent or already underway, and growth of auto sales ceases, including EVs, it will become readily apparent that the only sector keeping the economy from another debt-deflationary contraction is the oil and gas industry, which itself appears now to be peaking. But the oil and gas sector is growing at a net zero sum to the rest of the industrial sector and overall real final sales per capita.
Well, none of that’s realistic, but I don’t know how to convince you. We’re at that point in an argument where we’re starting to repeat ourselves.
Maybe we can start with a simple idea: that manufacturing doesn’t really require much energy (or oil, for that matter). Here’s GM’s report on the energy embedded in their new cars. GM says that .87 tons of CO2 and 2.22MWh are used to make each car. At 8.887 kg of CO2 per gallon, and 27 MPG, that’s 2,639 miles worth of fuel. That suggests that only about 2% of a car’s lifetime emissions come from it’s manufacturing.
http://www.greencarcongress.com/2014/05/gm-reduced-energy-intensity-and-carbon-intensity-per-vehicle-in-2013.html
So, it’s really doesn’t take much energy to make new cars to replace old, fuel intensive vehicles.
Does that make sense?
As I recall from many years ago, an economist name Nicholas Georgescu-Roegen had something to say about all of this. Seems to me that it is still relevant.
Indeed, John, as did Frederick Soddy before him, including his critique of fraudulent, unsustainable, financial bubble-inducing fractional-reserve banking that no economist is permitted to critique today if s/he wants to keep her/his job perpetuating the fraud and fallacious first economic principles such as the ecosystem being a subset of “the economy” rather than the precise converse that is actually the case.
Professor Hamilton,
If a VAR is “run” with the percent change in oil prices as the first entry and the percent change in GDP is the second variable, would this be instructive to show the impact of the percent change in real oil prices on the percent change in real GDP?
Take a look at the professor’s graph of the real price crude petroleum.
Does anyone know what happened June 30, 1879? (hint: Lincoln’s “greenback.”)
Does anyone know what happened August 15, 1971? (hint: the US steals from every country in the world.)
Does anyone know what happened October 1976? (hint: it happened in Jamaica)
Do these changes line up with anything on the graph? Let me say that no one can actually “adjust” numbers for inflation because no one knows how much of a price change is due to a change in the value of the currency or a change in the value of commodities or international events such as floating currencies (another hint).
I was listening to a discussion of “renewable” fuel this weekend and the topic turned to the fact that the sun provides significantly more energy than we can use and what is needed is a storage system for sun energy. The discussion then turned naturally to battery power and electricity. I was amused. Every energy source we have is a storage system for the sun’s energy. Wood is the storage of sunlight by plants for example. The question is not storage but the most efficient storage. Today that is coal, oil, and natural gas – all storage units of the sun’s power. Other storage systems such as wind and solar cells are simply worse methods of storage, less efficient and much less reliable. Because oil, coal, and natural gas are such wonderful storage units, it seems a little foolish to say we do not have proper storage units.
I have said it before, the market will find the best, least polluting, and most efficient sources of energy on our planet and will develop the best storage systems. Central Planning only retards the advance of technology. The professor, as usual, uses good sense in discussing the fact that the most powerful tool we have is human brain power and ingenuity. Now we just need to get the hand of the political class out of the pockets of the energy producers and storage unit producers so they can work to peak efficiency. Who knows the political class of parasites may even find productive was to join society if they are forced to actually do productive work.
Ricardo,
I’m disappointed to not hear any mention of pollution, climate change or otherwise, or the enormous security costs of oil.
Dealing with pollution (and other external costs, like security of supply) isn’t hard, nor does it require central planning. It just requires that we figure it’s costs into our accounting. We include the costs of pensions and stock options. We should include other costs, like those of pollution.
I understand that the Koch brothers have been working for 40 years to distort our understanding of libertarian principles for their benefit. But, we need to filter out their self-serving misinformation. Libertarians understand that theft is not ok. That includes the theft of our clean air.
I think that Prof. Hamilton is trying to say, in his lowkey and conservative way, that oil is an unreliable commodity, and that it is highly risky to plan our transportation system around it.
Oil’s unreliability has caused several recessions. It has caused several oil wars, the cost of which are measured in both blood and treasure (how many veterans who’ve lost their lives, or who suffer with disabilities and PTSD, are we willing to “pay” for our oil?).
If we also include the costs of pollution and corruption (E.g., Putin, not to mention “Saudi” Arabia – a country named for the kleptocrats who run it), we’ll find that oil is very expensive indeed.
It’s time for both public policy and private choices to move towards better and less expensive alternatives, especially electric transportation.
I think the link for the Handbook of Energy and Climate Change http://dss.ucsd.edu/~jhamilto/handbook_climate.pdf is broken – at least, it’s not working for me…
Now it’s working.
Strangely, there is no chart showing the supply of landfill products. Perhaps that’s because the supply seems to be endless while the demand is minimal. So, why hasn’t someone done something about that in a way that benefits everyone. Well, some have tried, but in a world obsessed with perfection, it is difficult to satisfy those who demand it. Still, wouldn’t it be great if we could take that endless stream of trash and convert it into an endless stream of energy to power those Teslas and TVs? Wouldn’t it be great if we didn’t have to burn coal for electricity or maybe even not burn natural gas? Why we could greatly reduce the mining and drilling while we make electricity so cheap that everyone would want to replace their petroleum powered vehicles with electric powered ones.
Well, we may not quite be there, but if all of those charts/graphs are the future of fuel, we’ll be there sooner than later.
https://docs.google.com/viewer?url=http%3A%2F%2Forangecountyvoice.org%2Fimages%2FPlasmaGasificationofWaste_Dodge.pdf
James,
Very good post
I am surprised you do not mention the works on commodity prices done by John Baffes at the World Bank.
http://www-wds.worldbank.org/external/default/WDSContentServer/IW3P/IB/2013/05/21/000158349_20130521131725/Rendered/PDF/WPS6455.pdf
It shows the link between oil/energy and commodities is very strong. His messages :
Energy is very important for agriculture (and a key driver of food prices), because: (i) agricultural prices respond twice as strongly to oil prices compared manufacturing prices and (ii) agriculture is 4-5 times more energy intensive than manufacture, across countries or regions.
The role of biofuels (which has been hotly debated on three fronts: energy independence, CO2 emissions, and food price increases) could become even more important, if they become profitable.
Regards
Michel
Nick G,
You would do yourself a favor if you did a little study on the research of pollution in the world. The industrial nations led the world out of the pollution crisis. Those countries with a capital base and the ability to manufacture always turn to those industries that the consumer wants. Once the most urgent needs are satisfied the consumer demands cleanliness. The worst diseases in the world are in the developing world not because of lack of medicine or health care, though those do make the problem worse; the have the worst problems because they do not deal with sanitation.
You do not have much appreciation of the miracle of sanitation in the US until you travel to other countries and the sanitation miracle is not because of government. It was the free market responding to consumer demand that has created the healthy conditions in the industrialized world.
Finally, do you know the worst polluter in the US? It is government. Government of all entities can waive health restrictions to allow it to pollute and it waives restriction on itself quite often. The free market has made us prosperous and clean. Command economies are what you would expect, the worst polluters.
ricardo,
this is ideology on so many levels! sanitation was brought about by the collective efforts of the citizens of a community, in the early days by the local government with state oversight, and from the 1950’s on with support from the federal government. this was not the result of free markets. this was the result of citizenry demanding their communities and water become safe from pollution resulting from sewer and water distribution. this was not an outcome from the community achieving their immediate consumer needs and then demanding cleanliness, as you stated in your support of free markets. this was the result of a community deciding to protect the health of the population in general, and spending the collective funds to make this happen. many third world countries have not received this benefit because decision making is not made by the community via democratic elections.
Ricardo wrote: “You do not have much appreciation of the miracle of sanitation in the US until you travel to other countries and the sanitation miracle is not because of government. It was the free market responding to consumer demand that has created the healthy conditions in the industrialized world.”
Sorry, this statement is nonsense. If you knew a little bit about 19th century history of medicine and technology you would realise that sanitation was indeed in many countries a direct result of actions of the governments.
Do you really believe that London got her sewer system because of consumer demand and free nmarket? That Hamburg lost almost 9000 citizens in 1892 because of lack of consumer demand or lack of free market, while Altona -today part of Hamburg, back then city under Prussian government- very few?
It is the other way around, good governments care for sanitation, because it is a very economic approach considering differential costs of sewer system vs. loss of economic activity as result of epidemics. The Hamburg case is a good example that free market is not always the solution, free market does not necessarily provide deeper understanding of technology and often does not create startegically sensible solutions due to the wrong timeframe the actors operate in.
I fear, your ideology makes you blind and deaf.
EXCERPT:
“The “sins of Hamburg” were great, and eventually found her out. Nature had dealt very gently with her breaches of the eternal laws of health. Thirteen comparatively mild epidemics had failed to suggest to the city authorities the necessity of putting their house in order. The Elbe water was still supplied in all its native and imported impurity, and then came the fourteenth warning, sadder, sharper and effectual, and Hamburg has risen to the occasion. From her commercial position and harbor accommodations Hamburg is peculiarly open to the importation of foreign diseases, and it is only by keeping her hearths well garnished and the city household in health that she can afford to admit suspicious visitors. It is a matter of menace and regret that she did not enforce compulsory cremation during the cholera epidemic. A beautiful crematorium, hitherto practically unused, stood all through the epidemic as a silent but eloquent monument to the prejudices of the people. In certain conditions of the soil a cholera body is more dangerous to the community when below than when above the ground, and it is much to be feared that a heavy day of reckoning must come when it is remembered that countless thousands of cholera corpses are giving their noxious emanations to the atmosphere of Hamburg.”
“…Tracts were distributed broadcast among the patients in the German hospitals persuading them in solemn language that the cholera epidemic was a merciful dispensation on the part of a wise Providence, and that the gentle chastisement had been sent as a reminder that their ways of life were evil. But not a word was said of the evil ways of the authorities of the city, who allowed the water supply to become so polluted that “death in the cup” might be taken more as a statement of fact than as a poetical exaggeration. [My Emphasis]
From a paper written by Miss Annesley Kenealy, a volunteer nurse during the cholera epidemic in Hamburg in 1892
Interesting. And, clearly, we see that public health is a central government responsibility, performed for all citizens, and not for “consumers”.
The fact that government sometimes fails in that responsibility reminds us that good government is important. A lot of “good government” is responsiveness to all of it’s citizens, as opposed to serving a very narrow set of high income or corporate special interests. Good government is government that is strong enough to resist pressure from such special interests, and democratic enough to know and respond to the needs of all it’s citizens.
In this case, the US government has been dominated by oil interests for quite some time. The 1950’s US Secretary of Defense, “engine” Charlie Wilson, built the highway system ostensibly to facilitate military transportation, but it certainly helped GM, the company he was CEO of, to sell a lot of vehicles. The first gulf war was prosecuted by an oil guy – the US was very fast to defend Kuwait, not so fast to defend CAFE standards which helped to reduce the need for Kuwaiti oil. The second gulf war was prosecuted by a couple of oil guys – the VP’s company stood to gain quite a lot of business from freeing Iraq from trade restrictions.
Oil and coal are very, very expensive – the only reason we’re not eliminating our dependence on them very quickly is the excess influence of people like the Koch brothers.
Oil and coal work (they produce dependable, cost effective power) the alternatives that are supposed to replace them don’t. That simple fact is why petroleum and coal continue to be used.
Oil and coal certainly produce power, but is it dependable, or cost effective?
How many recessions have been caused by oil shocks. How is that dependable? How many wars have been fought over oil? How is that cheap?
Look at all the costs of coal:
Coal: occupational health costs, CO2, acid rain, mercury in food, water consumption, adding up to $.18 per kWh ($345B/year):
“The United States’ reliance on coal to generate almost half of its electricity, costs the economy about $345 billion a year in hidden expenses not borne by miners or utilities, including health problems in mining communities and pollution around power plants, a study found.
Those costs would effectively triple the price of electricity produced by coal-fired plants, which are prevalent in part due to the their low cost of operation, the study led by a Harvard University researcher found.
“This is not borne by the coal industry, this is borne by us, in our taxes,” said Paul Epstein, a Harvard Medical School instructor and the associate director of its Center for Health and the Global Environment, the study’s lead author.
“The public cost is far greater than the cost of the coal itself. The impacts of this industry go way beyond just lighting our lights.”
http://uk.reuters.com/article/2011/02/16/us-usa-coal-study-idUKTRE71F4X820110216?rpc=401&feedType=RSS&feedName=environmentNews&rpc=401 or http://solar.gwu.edu/index_files/Resources_files/epstein_full%20cost%20of%20coal.pdf or here’s the link to the pay-wall-protected version if desired:
http://onlinelibrary.wiley.com/doi/10.1111/j.1749-6632.2010.05890.x/full
Cost table on page 92 (20 of 26) includes 3.06 cents for CO2.
Nick G,
Your original statement was.
My response was
You responded with some questions and a link to a speculative paper that says coal power should cost more.
Some of the links were broken and the full paper was not easily accessible. The portions of the paper that were accessible tend to show the paper is deeply flawed because it does not look at the costs or results of tripling the cost of coal power.
Tripling power costs will have an impact on people and it is completely possible that the negative impacts of that cost increase would exceed the speculative costs mentioned in the linked paper.
The statement that the( non nuclear, non natural gas) alternatives to oil and coal do not produce dependable cost effective power that can replace oil and coal stands.
You responded with some questions
I thought they were self-explanatory, rhetorical questions. Let me make them clearer:
How many recessions have been caused by oil shocks? How is that dependable?
the 2008 recession vaporized roughly $6T in wealth around the world, and created a long-term $1T annual output gap. Other oil recessions: 1973,1980,1991,2001.
http://www.forbes.com/sites/robertlenzner/2013/09/01/higher-oil-prices-are-being-caused-by-events-in-libya-iraq-nigeria-and-egypt-as-well-as-syria/
How many wars have been fought over oil? How is that cheap?
“In 2006, the cost of our military expenditures related to oil (like protecting the supply route from the Persian Gulf) was estimated at $133 billion a year.” http://www.smartplanet.com/blog/energy-futurist/reframing-the-transportation-debate/128
Here’s a useful discussion:
Direct subsidies and subsidies in the form of tax breaks for fossil fuels, estimated at 480 billion U.S. dollars in 2011, equivalent to 0.7 percent of global GDP. These subsidies are mainly a problem in the oil-exporting countries account for two thirds of total subsidies.
But according to the report from the IMF as should the cost of non-internalized externalities, ie. cost of environmental degradation as a result of consumption and production of fossil fuels are included in the final bill for the subsidies. Despite the difficulties and controversies in pricing our pollution, this calculation method shows, according to the IMF, the total subsidies amounted to astronomical 1900 billion dollars in 2011, equivalent to 2.5 percent of global GDP, or 8 percent of all government revenues. The world’s richest economies account for 40 percent of these subsidies because the largest emissions come from there and the oil-exporting countries, only one-third.
http://www.imf.org/external/np/pp/eng/2013/012813.pdf
a speculative paper that says coal power should cost more.
Well’s it’s a Harvard researcher. Have you read it? More importantly it doesn’t say it *should* cost more, it says it *does* cost more. The problem is that the costs aren’t in the price. That’s an important difference.
Here’s another study:
Direct subsidies and subsidies in the form of tax breaks for fossil fuels, estimated at 480 billion U.S. dollars in 2011, equivalent to 0.7 percent of global GDP. These subsidies are mainly a problem in the oil-exporting countries account for two thirds of total subsidies.
But according to the report from the IMF as should the cost of non-internalized externalities, ie. cost of environmental degradation as a result of consumption and production of fossil fuels are included in the final bill for the subsidies. Despite the difficulties and controversies in pricing our pollution, this calculation method shows, according to the IMF, the total subsidies amounted to astronomical 1900 billion dollars in 2011, equivalent to 2.5 percent of global GDP, or 8 percent of all government revenues. The world’s richest economies account for 40 percent of these subsidies because the largest emissions come from there and the oil-exporting countries, only one-third.
http://www.imf.org/external/np/pp/eng/2013/012813.pdf
the paper is deeply flawed because it does not look at the costs or results of tripling the cost of coal power.
Again, we’re talking about real costs which have simply been misallocated. Every dollar of military costs that we pay for with a fuel tax instead of an income tax represents a tax cut for the income tax payer. The average person will see a reduction in income taxes that will balance the increase in fuel taxes. But – and here’s the key – that average person will be incentivized to reduce fuel consumption, thus improving their overall financial position. That’s why proper allocation of costs in a free market creates a proper allocation of resources.
Finally, The statement that the( non nuclear, non natural gas) alternatives to oil and coal do not produce dependable cost effective power that can replace oil and coal stands.
Well, that’s not realistic. Intermittency isn’t that hard: demand side management is very powerful and underutilized, geographic diversity will reduce variance, and we have lots of NG for balancing. In the very, very long run we can use DSM and storage for daily variation, combined with overbuilding and some modest backup from biomass for seasonal variation. Here’s an article that might help:
“forecasts are helping power companies deal with one of the biggest challenges of wind power: its intermittency. Using small amounts of wind power is no problem for utilities. They are accustomed to dealing with variability—after all, demand for electricity changes from season to season, even from minute to minute. However, a utility that wants to use a lot of wind power needs backup power to protect against a sudden loss of wind. These backup plants, which typically burn fossil fuels, are expensive and dirty. But with more accurate forecasts, utilities can cut the amount of power that needs to be held in reserve, minimizing their role.
Before the forecasts were developed, Xcel Energy, which supplies much of Colorado’s power, ran ads opposing a proposal that it use renewable sources for a modest 10 percent of its power. It mailed flyers to its customers claiming that such a mandate would increase electricity costs by as much as $1.5 billion over 20 years.
But thanks in large part to the improved forecasts, Xcel, one of the country’s largest utilities, has made an about-face.
It has installed more wind power than any other U.S. utility and supports a mandate for utilities to get 30 percent of their energy from renewable sources, saying it can easily handle much more than that.
..forecasts from NCAR are already having a big effect. Last year, on a windy weekend when power demand was low, Xcel set a record: during one hour, 60 percent of its electricity for Colorado was coming from the wind. “That kind of wind penetration would have given dispatchers a heart attack a few years ago,” says Drake Bartlett, who heads renewable-energy integration for Xcel. Back then, he notes, they wouldn’t have known whether they might suddenly lose all that power. “Now we’re taking it in stride,” he says. “And that record is going to fall.””
http://www.technologyreview.com/featuredstory/526541/smart-wind-and-solar-power/
Key sentence from the article Nick G linked
1.) Mandates required because they don’t think they can compete without it.
2.) Thirty percent is a long way from Nick’s original assertion that Oil and Coal could be easily replaced.
Nuclear might, natural gas might, but each of those have complications. Renewables won’t and the quote form his linked article shows this.
Mandates required because they don’t think they can compete without it.
If coal’s pollution levels weren’t a problem, no one would be worrying about replacing it with wind power. Pollution isn’t priced into the price of coal, so coal can appear cheaper, even when it’s much more expensive after accounting for the cost of pollution.
Thirty percent is a long way from Nick’s original assertion that Oil and Coal could be easily replaced.
Not really. Oil and coal together only account for about 40% of US electrical generation.
Renewables won’t and the quote form his linked article shows this.
No, it really doesn’t. The article says that “it can easily handle much more than that.”. Clearly, wind can replace coal. Once we’ve replaced coal, we can work on finding the optimal balance between wind, natural gas, solar and nuclear.
Your original comment on June fourth said nothing about electricity generation.
Thirty percent is an overestimate because it does not include capacity factor
Should be careful when extrapolating the results from one regional utility to overall US power generation. What can be done in one region may not be possible in others.
The negative impact of higher power prices are still being ignored.
The facile statement that oil and gas can be replaced by alternatives fails.
Your original comment on June fourth said nothing about electricity generation.
Well, coal isn’t really used for anything else. I’m not sure what you’re getting at.
Thirty percent is an overestimate because it does not include capacity factor
The article is talking about percent of kWhs. In other words, 30GW of power might be generated, and 9GW is coming from wind.
Should be careful when extrapolating the results from one regional utility to overall US power generation. What can be done in one region may not be possible in others.
If you look at analyses from various system operators, you find similar results. Look at NYSERDA, for instance. Or ERCOT (Texas).
The negative impact of higher power prices are still being ignored.
Don’t you believe in free markets? Or, do you feel that oil or coal should be subsidized and the prices kept artificially low, if the price is hurting consumers?
Nick G,
An honest evaluation of the cost of different types of power generation has to include the negative impact of increased costs of power on consumers.
Making power more expensive has a definitive negative impact on people and the more poor the end consumer is the worse the impact is.
Most advocates of alternatives have never had to do without power or choose between heating their house and buying food.
As a result they remain unaware of the very real harm higher power costs cause.
Scots fuel poverty fears over green energy plans
We seem to be at that point in an argument where we’re repeating ourselves. I don’t know how to rephrase this stuff so it makes sense to you.
Again, these studies don’t say energy *should* cost more, it says it already *does* cost more. The problem is that the costs aren’t in the price. That’s an important difference.
Again, energy is more costly than we realize – we’re just not properly accounting for it. It costs, say, 5 cents per kWh for labor and fuel, and then it costs 5 cents to clean up (or suffer with) the pollution. So, it costs 10 cents, but people only pay 5 cents in their bill.
Again, we’re talking about real costs which have simply been misallocated. Every dollar of military costs that we pay for with a fuel tax instead of an income tax represents a tax cut for the income tax payer. The average person will see a reduction in income taxes that will balance the increase in fuel taxes. But – and here’s the key – that average person will be incentivized to reduce fuel consumption, thus improving their overall financial position. That’s why proper allocation of costs in a free market creates a proper allocation of resources.
Do you feel that oil or coal should be subsidized and the prices kept artificially low, because the realistic price would hurt consumers?
Nick G said,
I follow what you are saying, once you understand that trying to use alternatives to replace traditional power sources also has costs (as discussed in the article on Scottish power poverty) there will be agreement.
Honest cost benefit analysis of alternatives requires evaluating that impact of the additional cost of alternative energy.
Alternative energy advocates consistently ignore the additional cost of alternatives which renders their power cost analysis incomplete, inaccurate, and not useful for evaluation of power policy.
trying to use alternatives to replace traditional power sources also has costs
Sure. Renewable power may well be priced higher than dirty fossil fuels (by which I mean fossil fuels which are allowed to emit various pollutants). If you require coal plants to clean up their sulfur and mercury, then US onshore wind is cheaper than coal. That doesn’t even include dealing with CO2.
as discussed in the article on Scottish power poverty
Sounds like their trying to eliminate both nuclear and fossil fuels at the same time. That’s a mighty tall order. Doing both in only 5 years will be more expensive than something a bit less ambitious.
Honest cost benefit analysis of alternatives requires evaluating that impact of the additional cost of alternative energy.
Sure. As we saw in the article about Exelon, alternative energy’s impact is not that great. Exelon is managing to get up to 60% with just greatly improved forecasting – no expensive (additional) 100% backup, no big expansion of long-distance transmission – just improved forecasting. Just software!
Alternative energy advocates consistently ignore the additional cost of alternatives which renders their power cost analysis incomplete, inaccurate, and not useful for evaluation of power policy.
That’s not correct. I think if you look carefully, you’ll find that such claims come from sources with hidden agendas.
Professor,
I am sorry. I did not intend to change the debate on this thread to focus on sanitation. My intention was to bring in the importance of the innovator in a free market to solve the problems we face with energy. I will refrain from replying to more comments on sanitation, since that is not the focus of your post.
Ricardo, the fact that you are incorrect about the evolution of sanitation should be the reason you discontinue the conversation.
“My intention was to bring in the importance of the innovator in a free market to solve the problems we face with energy.”
I am in agreement with you that innovation can be obtained in the free market for energy, but that does not mean the government has no role in defining the direction of that market, ie from fossil fuels to renewable forms of energy.