As the U.S. economy returns to healthier growth, many of us expected long-term interest rates to return to more normal historical levels. But the general trend has been down since the end of the Great Recession. The 10-year rate did jump back up in the spring of 2013. But during most of this year it has been falling again.
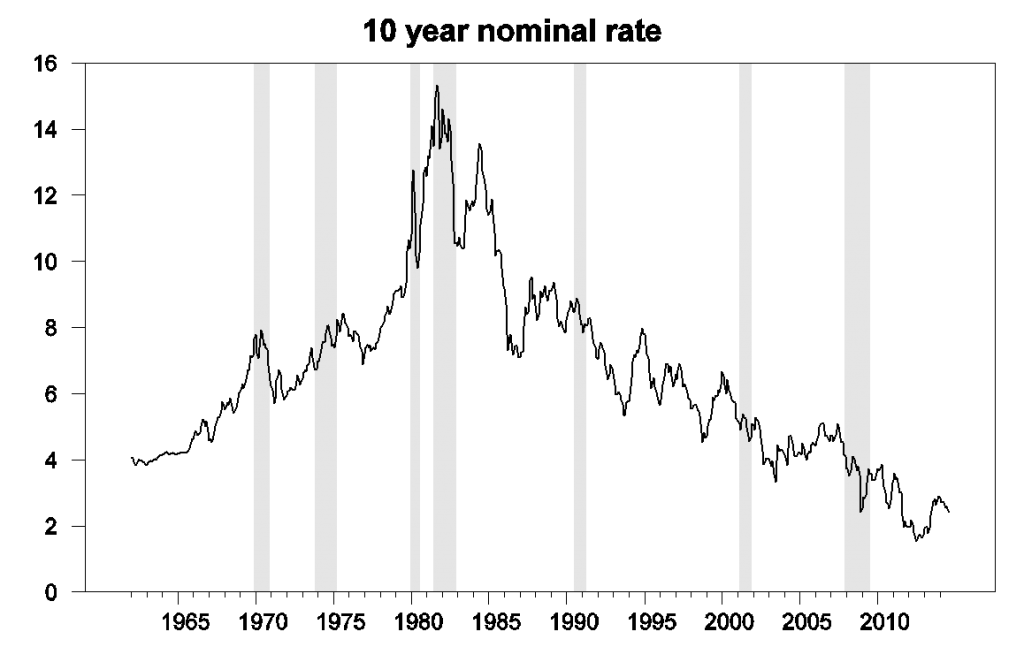
Nominal yield on 10-year U.S. Treasury bond, from FRED.
And it’s not just that people are getting used to the idea that inflation is always going to be low. The drop in the yield on a 10-year Treasury inflation-protected security (TIPS), whose coupon and par value go up with the headline CPI, has also been impressive.
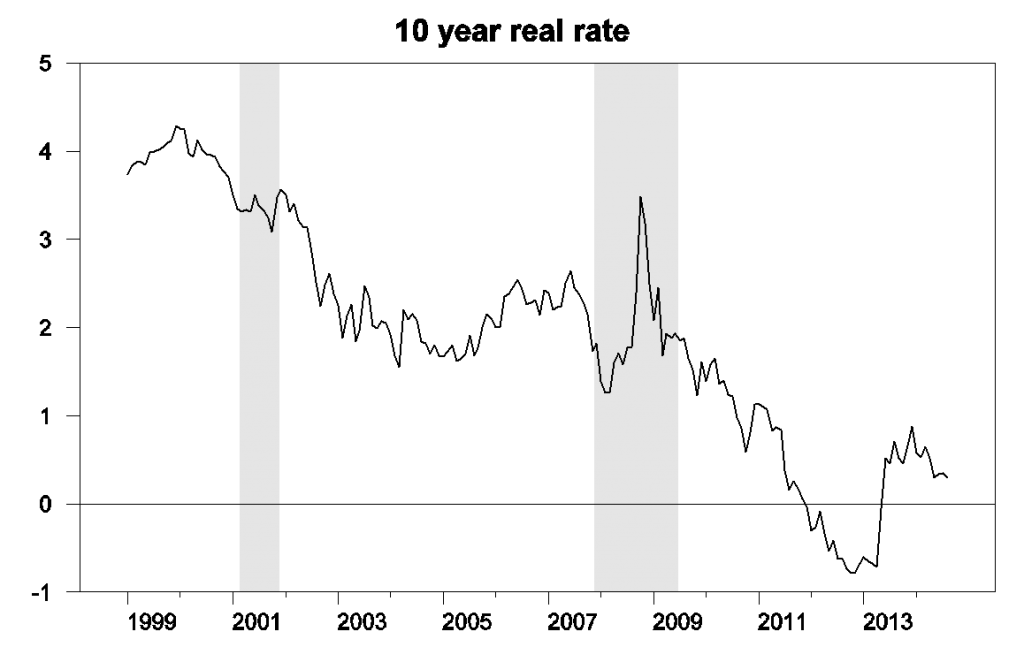
Yield on 10-year TIPS. Data source: Gürkaynak, Sack, and Wright.
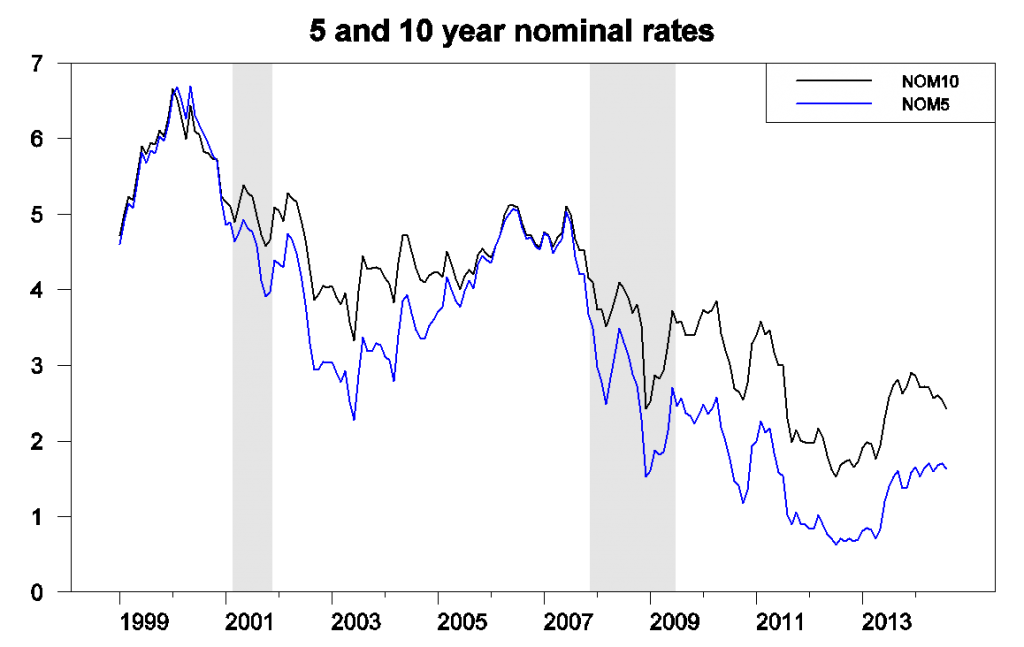
But here’s an interesting detail. While the return on a 10-year Treasury has been falling for most of this year, the 5-year yield has held fairly steady.
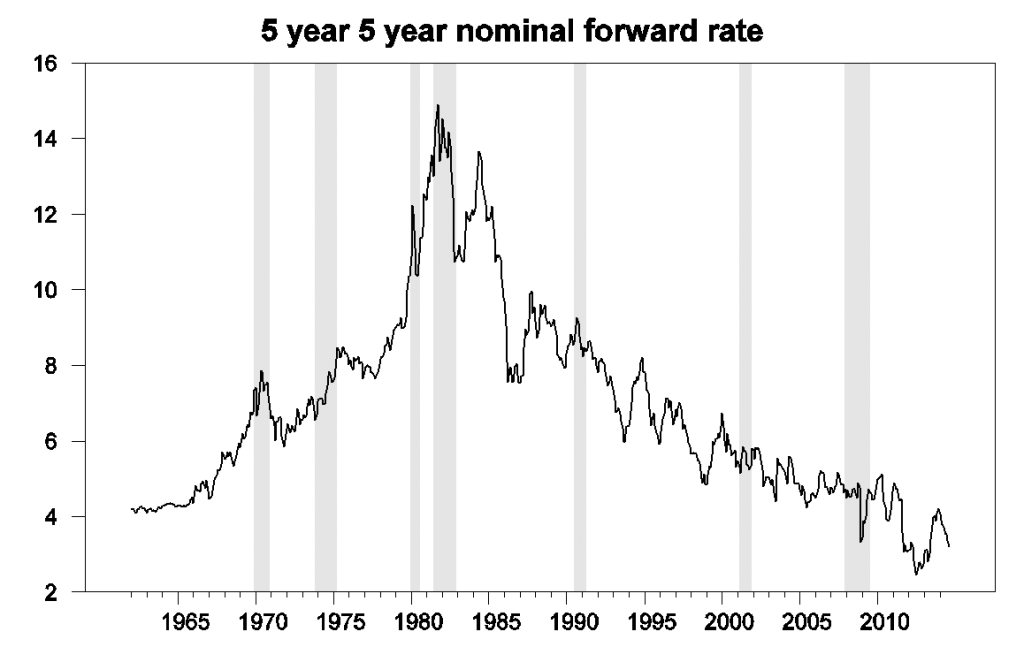
Sometimes we summarize the relation between those two yields using a forward rate. If today you simultaneously bought $1000 worth of a pure-discount 10-year bond and sold $1000 worth of the 5-year discount bond, it would be a complete wash in terms of the cash flow for the next 5 years. Five years from now you’d have to pay back the 5-year bond, and 10 years from now you’d get the proceeds from the 10 year bond. In effect you’ve locked in the terms today on a 5-year bond that you’re not going to buy until 5 years from now. The yield on that bond is known as the 5-year-5-year forward rate, and is plotted below.
If investors were risk neutral, you could read that forward rate as the market’s expectation of where the 5-year rate is going to be 5 years from now. The drop in the forward rate during 2014 would indicate that something happened this year to persuade people that rates in the future were going to be lower than they had been expecting.
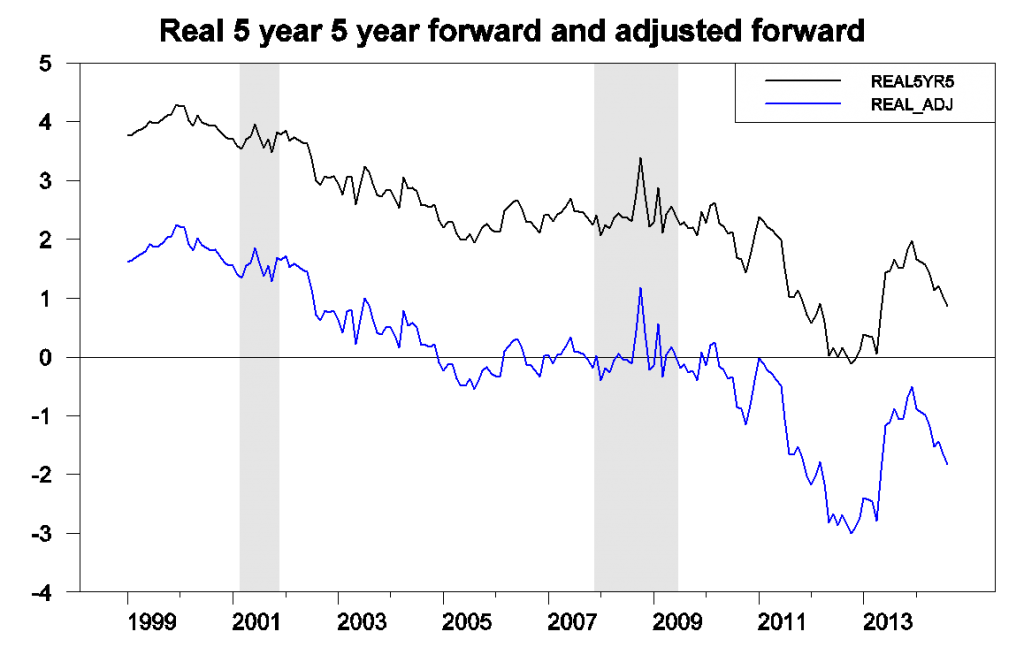
But there’s lots of evidence that markets are not risk neutral. The 10-year rate is almost always higher than the 5-year rate, not because people think that the 5-year rate is going to increase, but because they want extra compensation for locking up their money longer term. I made a very quick adjustment for risk aversion by using data since 1990 to regress the actual 5-year rate on a constant and what the 5-year-5-year forward rate had been 5 years previously, and used the fitted values of that regression as a “risk-adjusted” forward rate. This adjusted series is shown in blue along with the original in black in the graph below. The message is unchanged.
You can also calculate a real 5-year-5-year forward rate using the TIPS. Once you correct for pricing of risk, it looks like investors have been anticipating a negative real rate well into the future ever since the end of the recession. Expectations lifted in the first half of 2013, but have been falling sharply this year.
What could produce such a pattern? It’s hard to attribute it to changing perceptions about the Fed, which should surely matter more for the next 5 years than they would for 5 to 10 years from now. More confidence that the U.S. government will be able to keep debt from growing relative to GDP over the next decade may have played a role.
Another possibility is that more people are starting to take seriously the suggestion that we’re on a path now of secular stagnation with weak economic growth and poor investment opportunities over the next decade. But that’s hard to reconcile with the stock market, which climbed impressively this year.
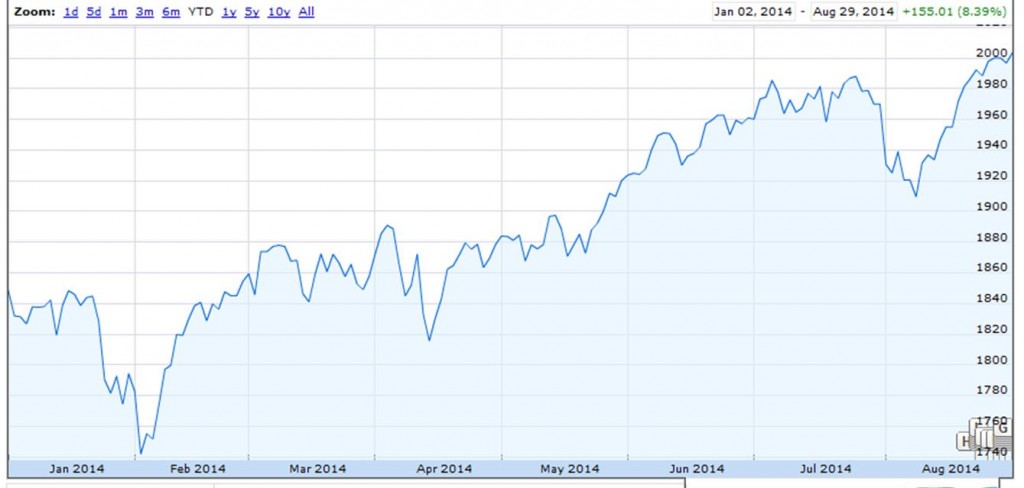
S&P 500. Source: Google Finance.
Or then again, maybe the market has simply overpriced both stocks and long-term bonds.

http://www.zerohedge.com/news/2014-08-30/its-settled-central-banks-trade-sp500-futures
That doesn’t answer anything.
IMO, bonds are overpriced and investors are in error. Not the first time. That said, the 10 year yield looks to only be in the 3.50-3.75 nominal area and that isn’t a overly huge sell off from today. Yes, a correction is due.
I think the May 2013 sell off was mostly Asian. Might be some Euro bleed over forcing a bit of a low volume buying causing what appears to be falling yields.
Rates are low because EU is faltering, Putin is not going away, US wages are far down from pre-2008 levels – let’s remember 40% of US households contend with a debt collection agency – and much of the Middle East could be destabilizing. All this aside from the debt debate in the US. Take away US company stock buybacks, and the stock gains are much more modest. Secular stagnation is at hand, with the occasional gut punches which evoke more easing from central banks. A lot of incentive to be on defense.
Last year we got the US Fed and the BoJ to formally agree on the Bundesbank Inflation < = 2.0% target
August 31, 2014 1:20 pm
US bonds are tracking ECB policy
By Robin Harding in Washington and Michael Mackenzie in New York
http://www.ft.com/intl/cms/s/0/5cf2601a-2f99-11e4-83e4-00144feabdc0.html?siteedition=intl#axzz3BdIcqR87
The problem with 2% price inflation is that the post-2007 trend rate of nominal GDP per capita is 2% or slower. Thus, an acceleration of price inflation faster than 1.8-2% results in stall speed or contraction SAAR for real GDP/final sales per capita.
Dumb question: what happened around April 2013, that might have caused real rates to rise quickly and strongly?
Nick: My interpretation of what happened in the spring of 2013 is here.
Nice. I like the 5-on-5 thing. So are the people in the bond markets the same folks who are in the equity markets? Unless traders are capable of extreme cognitive dissonance, or perhaps an extreme urge to hedge, it’s hard to see how the same person could make such two diametrically opposed bets and believe both are true. OTOH, I started out a secular stagnation skeptic but have since moved into the “more than moderately probable” category, but yet I’m still heavy into equities. So maybe cognitive dissonance R us.
Nick, that is the news that qe3 taper was coming faster than expected; I.e. The taper tantrum. Whether it makes sense is something else. Narrowly, it seems to supports the portfolio balance preferred habitat story in many of the LSAP event study papers, since stocks dropped and real rates rose on taper news days.
The economy is a twin engine plane with one engine out. So it has a slow downward spiral and one nice crash landing spot. It needs to get the phase of the spiral and the decline in elevation to match, hard to do.
JDH: One thing that we’ve learned about the stock and bond markets is that if they’re signaling two different things (stocks indicating a strong market, bonds indicating a weak one, or vice versa), the difference can often be attributed to what we would describe as investors in both markets having different time horizons in making their current day investment decisions. Speaking for the stock market, the focus had been on 2015-Q2, but appears to have been shifting backward to the nearer term future of 2014-Q4, which has much more positive expectations associated with it.
Nick: It’s actually May 2013 more than April – interest rates began rising on early speculation that the Fed would begin tapering its MBS and Treasury purchases. They spiked on 19 June 2013 during Bernanke’s press conference where he clearly indicated that the QE taper was in the cards.
The stock market has been a LAGGING indicator of the cyclical change rate of the economy since the hyper-financialization of the economy that began in earnest during the 1990s Dotcom bubble. With QEternity, the hyper-financialization has been exacerbated. The stock market is no longer a leading indicator of anything.
Rather, the stock market is a coincident indicator of increasing leverage via offshore TBTE banks’ dark pools and their assistance by central bank liquidity and cooperation by exchange-sponsored high-frequency trading (HFT) to “manage” forward equity index futures.
Were the public to fully understand what has been happening via TBTE banks’s shadow banking dark pools in “Caribbean banking centers”, “Belgium”, etc., since as long ago as 2010-11, rather than be angry, they will more likely demand that the process come out of the dark and be institutionalized and fully disclosed, including central banks announcing purchases of S&P 500 and Russell 2000 index ETFs and equity index futures as the Fed announces weekly POMOs.
Imagine banks, hedge funds, managed futures funds, pension funds, HFT, and retail traders all front running the Fed’s weekly equity index futures POMOs. If so, a new definition of bubble will be required, even though The Chair will still be claiming that a bubble does not exist or can’t be confirmed until after it bursts, i.e., the TBTE banks pull the plug on the bubble machine.
Professor Hamilton,
Are the “pure discount” bonds zero coupon bonds? Is the “$1,000 worth” the maturity value of the respective bonds or the cash in and out? If the $1,000 is the maturity value of the bonds, it seems that the discounted present value of the short sale and purchase could be different and impact the interest rate calculation of the forward rate.
AS: Yes, the example works for a zero-coupon bond, and $1000 is the cash cost today, not the par value. Your cash in at time 0 is $1,000, and your cash out at time zero is $1,000, so no money changes hands until 5 years, and you can calculate the return on that investment. The simple formulas I use assume continuous compounding, which I explained here.
Since WW II the long run trend growth rate of the US nominal economy and of the S&P 500 earnings per share has been 6.5%.
But in the last two cycles economic and earnings growth have failed to return to this trend growth rate.
I’ve long though of the market PE as an expression of the present value of a perpetual stream of 6.5% growth.
But expectation are now that long term growth is significantly short of the old trend.
In a regression of the S&P 500 PE against inflation, fed funds and bond yields from 1958 to 1995 the quick and dirty results implies that the relation between yields and the PE is roughly one-to-one. That is a 100 basis point move in yields generates a 100 point move in the S&p 500 PE.
According to that regression the market PE should now be 21 versus an actual PE of 17 — on trailing operating earnings.
This suggest that the market is already discounting a significantly lower long term growth rate than the historic 6.5% rate.
If this analysis is accurate than there is no conflict between the stock and bond markets as they are both discounting a significantly lower long term nominal growth than the historic norm of 6.5%.
Jim,
Your post and a FT piece by Robin Hanson made me curious about where the term premium was going in all of this. Here is what I found: http://macromarketmusings.blogspot.com/2014/09/another-bond-market-conundrum.html
Take a look at the product of the 10 year yield and the PE ratio of the S&P 500. Everyone likes to compare the 10 year yield to the earnings yield of the S&P (the inverse of the PE) so just multiply the 10 year yield times the PE ratio and you would think you’d get a constant, or at least a range. But it has been at new lows ever since 2009.
1. Is the fact that public holds a greater % of 2/5 Yr bonds and fewer 10/30 Yr bonds you blogged about earlier a coincidence rather then a smoking gun? This study is a bit dated . https://econbrowser.com/archives/2014/08/what-did-quantitative-easing-accomplish
2. From a user of money POV, this divergence of the 5/10 is telling me that the cost of capital to fund a new investments has been increasing over the next 5 years and the cost of capital to fund my new investments is decreasing beyond 10 years. This certainly suggest market risk beyond 5 years.
3. The other point I would note is that new pension rules passed last year, allow pension funds to purchase and hold more treasuries in their portfolio (as well as changes in Basel III ). The pension funds of course would purchase the 10 year and longer bond to better match cash flow to liabilities and hedge against risky equities that can fall as they did in 2009. I could be wrong but that’s my best guess and this divergence is a structural mispricing in the yield of long bold caused by pension demand whereas the 5 year is a better measure showing health of the economy and where the yield would be without this “rule change”. Said differently, without that rule change I’d expect the 10 year to rise and better correlate to the 2/5 year.
http://online.barrons.com/news/articles/SB50001424053111904125704579591940368655528
http://www.ft.com/intl/cms/s/0/dae08480-d90d-11e3-a1aa-00144feabdc0.html#axzz3C6HeDnmV
Spencer is right about their being no conflict between bond and equity prices. Unless you think the discounted cash flow model is wrong, you should expect equities to trend inversely to interest rates. Besides the S&P500 is multinational.
However it’s not only about anticipated growth rates, it’s also about Fed policy. The surplus of cash in the economy drives up the price of other assets relative to cash, including bonds and equities. In theory if more growth were anticipated more of that money supply would get utilized and perhaps generate a bit more inflation, but I wouldn’t assume that today’s low long rates reflect unadulterated forecasts of long-term growth. To suggest that would be to suggest that monetary policy makes no difference. Even the Fisher neutrality theory was only suggested to work in the long run.
I also think much of this year’s action is just retreating from last year’s overreactions now that Yellen has assured markets that dovishness still reigns.
While I am very comfortable with your factor analysis of 10 year pricing, as I started to examine 10 year came to the conclusion that the rally is actually very bearish, akin to the sea water drain before a tsunami – the curve is powerfully reorganizing yet ZIRP still anchors rates out to 5 year, so the curve from 5 to 30 year is flattening harshly in accommodate a rate hike at anytime, certainly before 12/14. I hung a graph at my blog with short discussion. Big regime change is about to occur, is my thought.
http://bathosontrading.blogspot.com/2014/09/us-treasury-10-year-no-conundrum.html
Observations: (1) The US did not return to healthier growth. Nor has it yet. Nor will it. The violation of this assumption is the primary reason why yields have fallen on trend this expansion relative to expectations. (2) The secondary shock wave following the Panic of 2008 – namely the eurozone crisis – took rates down another notch independent of US economic growth and inflation. This flight out of euro deposits has still not unwound. (3) Against this backdrop of subpar growth, PCE price inflation fell from late-2011 until recently. It is now up off the bottom of 1% it made from Sep 2013 through Feb 2014. Hence until this recent period, the medium-term inflation trend was downward. Naturally enough this put downward pressure on rates. (4) Within this unfolding story, the first hint that QE would be tapered came May 1st last year. The market was leaning one way. The news of impending tapering caused it to turn on a dime and compensate for its overshoot. As others point out, tapering is what caused the surge in rates May to Sep last year. (5) Here in 2014, tension in the Ukraine caused another bout of global flight-to-safety. This geopolitical factor more than offsetting the nascent rise in inflation. As of Friday, the Ukrainian crisis has the US 10-yr yield to within a tick of its YTD low.
More observations: (1) A reasonable projection for fed funds is an initial hike next summer followed by 25 basis point hikes thereafter every other FOMC meeting. Fed funds up 100 bp per year until it reaches terminal level. The 5-year average of fed funds in this case would be around 1.70%. Against this, compare the current yield on the 5-year of 1.63%. Expected fed funds wholly dominates the curve out to 2 years, and is powerfully causal a couple years beyond as well. Moreover, in the upward part of the rate cycle, ex ante market rates typically lag (remain below) what the 5-year average fed funds rate turns out to be ex post. (2) In using data from 1990 to present for regression analysis to calculate a risk factor there is a problem. The estimated coefficient from the regression is a homogenization of observations from two manifestly different periods – pre and post-crisis. Far better to use post-crisis observations only which would give a different result. (3) It is the decline in the 5-year forward this year that begs for explanation. However, other than superficial resemblance it is not really a conundrum at all like in 2004. Since the 5-yr yield has been roughly flat since January, nearly all of the downtrend in the forward has been due to the fall in the 10-year. Reasons: (a) Remarks of Fed officials this year, along with various FOMC releases, peg the initial funds rate hike around mid-year next year stabilizing 5-year yields, (b) Ukraine flight to safety is pressuring longer-term rates lower, (c) the strengthening labor market affects the short-end disproportionately as it plays directly into the fed funds outlook and hence the shorter end of the curve, (d) modest inflation is thus far keeping long rates from rising at the same time that reduced labor market slack is putting upward pressure on the short end of the curve (via fed funds expectations), (e) German 10-year has fallen dramatically this year (down 107 bp) causing arbitrage to flow disproportionately into the US 10-year since here and not the short end is where the spread has widened thus offering greater profit potential.
In summary, the curve flattening YTD is due to three twists: (1) labor market slack variables vs inflation variables, (2) Ukraine affecting the long end disproportionately, and (3) arbitrage opportunity at the long end due to faltering German economy (also tied to Ukraine and impact of sanctions). Thirty-seven percent of the daily movement in the US 10-year can be explained by the daily movement in the German 10-year. This is historically quite exceptional. This exceptionality can be easily understood by realizing that US economic and inflation releases, Fed statements including FOMC releases, flight-to-safety, auction results, technical factors, movement of fed funds, and a catch-all category normally explain nearly 100% of the daily movement in bonds. Finally, since some of the movement of German yields is because of the Ukrainian crisis, the direct and indirect impact of the Ukraine is large indeed.
The hypothesis inherent here is if the Ukrainian crisis is resolved in a swift surprising way, there will be a massive reversal in the trend of US bond yields. The bond market always runs on themes (e.g. last year the theme was tapering). The Ukraine is the current theme. So it will pay to look much deeper (read between the lines) to find out the real story of what is going on there rather than accept the grossly misleading story the media is putting out.
Professor,
Once again a spot on analysis.This is more evidence ” that we’re on a path now of secular stagnation with weak economic growth and poor investment opportunities over the next decade.” The stock market climb is because investors are grasping for yields and there is nowhere else to go. From what I read most investors expect the bottom to fall out of equities in the short-term but they are trying to cash in hoping to jump out when the crash comes. The only other alternative is to sit on cash, but with inflation even as low as 1.8-2%, sitting on cash is a losing position. Monetary inflation always shifts the economy from investment to consumption (the goal of Keynesian policy) and increases debt to fund short term investment. If the market is telling us this many are going to get burned.
We know this has been a weak “recovery,” the expansion is getting old, at 63 months, and a recession is likely within five years.
It’s uncertain how strong the recovery will be after the next recession, and how much growth we’ll get in the 2020s before the last of the Baby-Boomers (born between 1946-64) reach 65 in 2029.
The underlying assumption for higher long term rates is that the “U.S. economy returns to healthier growth”. I have been hearing that forecast for quite a few years and each year seems to come up short for the US and Europe. Van Hoisington attributes slower economic growth to too much debt (total debt to GDP).
http://www.hoisingtonmgt.com/pdf/HIM2013Q1NP.pdf pages 3-4
Maybe the bond market is a sign of slower economic growth?
The stock market was certainly a lagging indicator in 2008.
Stephen Neumeier ,
Excessive debt is the normal outcome of Keynesian policies. Keynesian theory says in a declining market stimulate demand. The monetary authorities attempt to do this throught the credit market. Both state and federal programs are instituted to increase private debt through special mortgage programs so private debt increases with consumer debt maxed out. Low interest rates encourage busnesses to expand their debt. Ultimately Keynesian policies push traders in the economy to take on excessive debt and when recovery does not come those with the debt are blamed. Monetary expandions and its child excessive debt does not bring recovery. Look at the savings rate relative to debt then determine for yourself if a healthy economy results from excessive debt or savings. The “paradox of savings” is only such in the delusion of a failed theory..
Hello there,
Is there any reason you didnt choose the 2yr?
It would be interesting to see how the risk premium you extract from the current 5yr rate and the historical 5y5y fwd changes over time. Does it generate a signal at either extremes ahead of equity turns?
I think concluding anything about fundamentals of the US economy from US rate markets today is verging on pointless given the Fed’s non-commercially motivated ownership of USTs (more than China and most of the Eurozone combined).
Or then again, maybe the market has simply overpriced both stocks and long-term bonds.
I think it’s unfair to call it “the market.” I’d call it a flood of liquidity from the central bankers. Just as the Fed is winding down its QE, the ECB is starting to take over.
All that newly printed money has to go somewhere, and it is quite clear that it has gone into global asset prices.
Is that a reason not to buy stocks and real assets? Au contraire! Neither the banks nor the governments can afford a collapse in asset prices. Therefore, asset prices will be supported even if it requires seriously devaluing fiat currencies.
The current trend since 1980 can’t continue, and I think once inflation reignites, it will be 1950-1980 again, only faster. US will keep QE until this happens, making it inevitable.