From Simon Kennedy in “Draghi Sees Almost $1 Trillion Stimulus With No QE Fight” (Bloomberg):
Mario Draghi signaled at least 700 billion euros ($906 billion) of fresh aid for his moribund economy and left a fight with Germany over sovereign-bond purchases for another day.
…
Draghi gave few details on the size or nature of the ABS plan, saying the “modalities” of the program will be announced in October. The ECB will initially target the less-risky segment of the market, which collapsed in the wake of the financial crisis after being criticized by politicians and regulators for being opaque. The ECB may consider buying more-risky versions if governments provide a guarantee.
“We want to make sure that these ABS are being used to extend credit to the real economy,” Draghi said. The measures “are predominantly oriented to credit easing.”
Weidmann, who has clashed with Draghi before over the need for stimulus, opposed the policy measures, according to two euro-region central bank officials. A Bundesbank spokesman declined to comment. In July, the German central-bank head called ABS purchases “problematic” and warned against supporting bank profits while socializing the losses.
…
Commerzbank AG economist Joerg Kraemer said there is still a 60 percent probability the ECB will eventually buy government bonds should its forecasts deteriorate.
One measure of the degree to which this announcement signals a looser monetary policy is indicated by the intra-day movement in exchange rates.
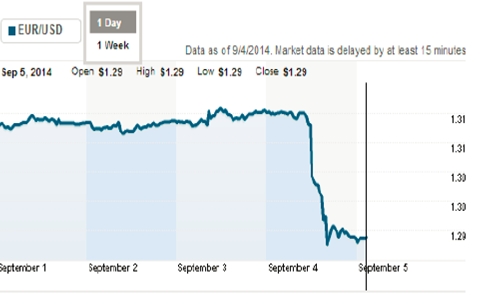
Figure 1: USD/EUR exchange rate, last five days. Down is a euro depreciation. Source: Reuters.
Context on the magnitude of the move is provided by reference to a longer time span — in this case, year to date.
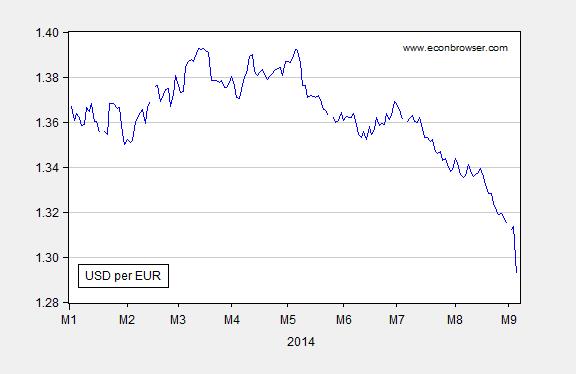
Figure 2: USD/EUR exchange rate, year to date. Down is a euro depreciation. Source: FRED and Pacific Exchange Services.
The drop against the dollar day-on-day was 1.6% (log terms), where the standard deviation of changes during the year-to-date was 0.3%. Update 9/7: this depreciation shows up in the trade weighted exchange rate as well.
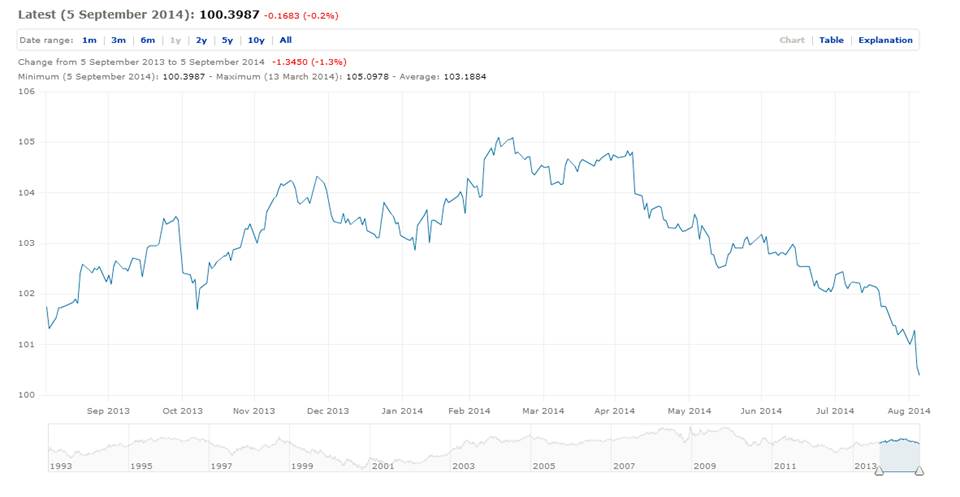
Figure 2a: Trade weighted value of the euro, over the last year. Source: ECB.
All I can say is that this measure is long overdue, given the sad state of Euro area economic growth, and the troubling deceleration in inflation, now at 0.3%.
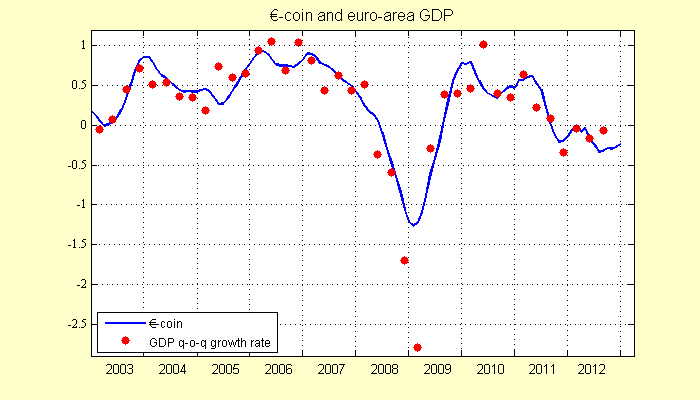
Figure 3: Quarter on quarter nonannualized Euro area GDP growth (red dots) and Euro coin indicator (blue line). Source: Eurocoin/CEPR.
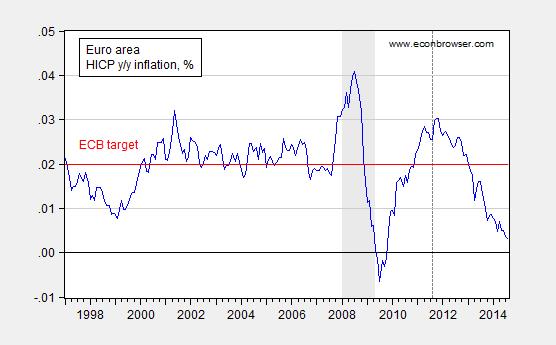
Figure 4: Year on year HICP inflation in the euro area (blue), and 2% ECB inflation target (red). CEPR defined recession dates shaded gray. Dashed line at mid-quarter of last announced peak (2011Q3). Source: FRED, CEPR, author’s calculations..
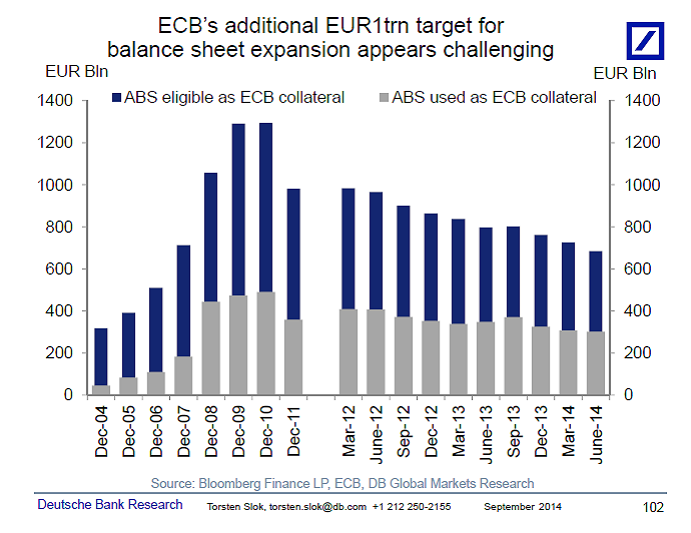
Update, 9/6 12:10PM: From Torsten Slok (9/5, not online):
The ECB wants to expand its balance sheet by EUR1trn, but the question is if they can find enough ABS and covered bonds to buy, see also the chart below. The direct impact on economic activity of balance sheet expansion is very limited. Instead, the main transmission channel of monetary policy here is via a depreciation of the euro. Expect EUR/USD to continue to grind lower, this is good for European exports and for European inflation and hence also for the ECB.
Menzie wrote:
All I can say is that this measure is long overdue, given the sad state of Euro area economic growth, and the troubling deceleration in inflation, now at 0.3%.
Menzie,
First, thank you for this post. I have seen a few obscure articles on how Draghi’s actions are having an impact on the US markets but no one seems to be discussing this seriously. Most seem to ignore what is happening in Europs as they head for a triple-dip recession.
Now to your quote, a rare instance where you sort of take a personal position without plausable deniability. I would love for yout to take this to its logical conclusion and make a prediction of what the consequences of this “long overdue” action. You love to criticize Scott Walker’s predictions. Are you willing to show the same courage and make your own? Walker is a politician and you are an economist. It seems that both professions require proof of their theoritical base.
The EU is tracking almost perfectly to a supply-constrained model for oil consumption. My 2009 prediction for EU oil consumption puts it right where it is today. Thus, a higher growth rate for the EU would imply faster efficiency gains; those have not been forthcoming for six years now.
On the other hand, the oil supply could increase more quickly. It’s an unbelievably choppy (and non-linear) time for the oil price and supply outlook. Shell announced yesterday it was shrinking its business on the oil side. Sinopec is also engaged in capex compression. So we’re going to see significant supply problems on the conventional oil side from late 2015 or so.
At the same time, unconventional growth in the US has been blowing the doors off, with production in July up 1.5 mbpd yoy (3 mma). With the Canadians, it’s 2.0 mbpd, and a supply-constrained model starts falling apart (reverts to demand-oriented) somewhere in the 2.0-2.5 mbpd / year range–something we can see in Brent prices. Inherent demand is calculated at 2.9 mbpd, so figure that, as the oil supply growth starts to reach to this level, we would expect to see rapidly increasingly oil price instability.
China’s oil demand also fell last month, with some pretty dire warnings on the economy there. Prices in a supply-constrained model are fundamentally supported by China’s carrying capacity. If China falters materially, then again a demand-constrained model will come to dominate.
I’d add that one has to wonder whether China is beginning to come off the rails. Is Xi emulating Singapore, or Hungary? None of Singapore, Hungary or Russia today could be considered full democracies. However, governance in Singapore is superb; it is quite poor in Hungary and Russia. Which way is China going?
Re: US Oil Production
It seems to me that almost no one in the media is paying any attention to decline rates. Note that a few years ago, circa 2005 or so if memory serves, ExxonMobil put the global decline rate from existing oil wells at about 4% to 6% per year.
The EIA’s numbers for the decline rate from existing Bakken and Eagle Ford Shale Play oil wells are at about 6% and 8% respectively, except that they are talking about per month, rather than per year, decline rates.
Some numbers for extrapolated declines:
If we combine the December, 2013 EIA numbers for Bakken + Eagle Ford, they produced 2.2 mbpd of Crude + Condensate (C+C) in December, 2013.
If we extrapolate the EIA’s estimates for month over month declines in legacy production*, the oil wells completed in these two plays in 2013 and in prior years would be down to a combined production rate of about 0.9 mbpd in December, 2014, about a 60% decline in one year.
Or, in other words, based on EIA data, the industry would have to add 1.3 mbpd of new production from 12/13 to 12/14, just to offset declines from existing Bakken and Eagle Ford wells (completed in 2013 and prior years).
The EIA puts US C+C production at 7.9 mbpd in December, 2013. If we assume that the balance of existing US C+C production (excluding Bakken + Eagle Ford) is declining at about 7%/year, the remainder of US C+C production in December, 2013 would decline by about 0.4 mbpd from 12/13 to 12/14.
Based on the foregoing, existing US oil wells as of December, 2013 would decline by about 1.7 mbpd from 12/13 to 12/14, and again based on the foregoing, just to maintain US C+C production for 10 years, the US would have to put on line the productive equivalent of about 17 mbpd, or approximately the productive equivalent of the current production from Iraq, times six.
So far, the US oil industry has been able to offset declines and add new production, but the higher the production rate, the greater the volumetric loss of production from prior wells, which is why Peaks Happen. As you know, It’s when, not if, that the industry is not able to offset the declines from existing wells.
*If we are looking an projecting multi-year declines, one would need a hyperbolic or two-step exponential decline estimate, but for just 12 months, I think it’s reasonable to extrapolate the current EIA monthly estimates.
Re: China & Developing Countries
Based on the linked article, it appears that we are headed toward record global auto sales in 2014:
http://www.gbm.scotiabank.com/English/bns_econ/bns_auto.pdf
Of course, the critical question is the percentage of global new vehicle sales in developing countries (with presumably low scrappage rates) versus developed countries (with high scrappage rates).
There have definitely been some signs of flat to lower oil demand in China, but one variable that is hard to quantify is an increase or slowdown in the rate that they are putting oil into their strategic reserve. Of course, the market doesn’t differentiate between a barrel bought for storage versus a barrel bought for consumption, but a decline in storage purchases would not mean a structural change in underlying demand, and it appears that China’s car sales are up 15% year over year.
In any case, the preliminary 2013 EIA data (which has some revisions to prior years) indicates that what I define as Available Net Exports, or Global Net Exports of oil (GNE) less Chindia’s Net Imports (CNI), fell from 41 mbpd in 2005 to 34 mbpd in 2013. In other words, the volume of GNE available to about 155 net importing countries fell by 7 mbpd from 2005 to 2013.
Incidentally, a recent article indicated that 0.5% of new global vehicle sales in 2014 would be electric or plug-in hybrid.
Preliminary 2013 Depletion Update for Global Net Exports of Oil
Some definitions:
Global Net Exports (GNE) = Combined net exports from (2005) Top 33 net oil exporters, total petroleum liquids + other liquids (EIA), which accounted for about 99% of total global net exports of oil in 2005
CNE = Cumulative Net Exports (for a given time period)
ECI (Export Capacity Index) Ratio = Ratio of production to consumption
Six Country Case History. The Six Country Case History consists of the major net oil exporters (net exports of 100,000 bpd or more) that hit or approached zero net exports from 1980 to 2010, excluding China. China, like the US, became a net importer prior to a production peak, because of a rapid rate of increase in consumption. Combined production from the Six Countries virtually stopped increasing in 1995, showing only a 2% increase from 1995 to 1999.
The following chart shows the normalized values for production, ECI Ratio, net exports and remaining post-1995 CNE (Cumulative Net Exports) by year (1995 values = 100%).
http://i1095.photobucket.com/albums/i475/westexas/Slide2_zps6c3a6280.jpg
Note that even as production increased slightly from 1995 to 1999 (by 2%), net exports fell, because of rising consumption, as illustrated by the decline in the ECI Ratio. And note that even as production increased from 1995 to 1999, remaining post-1995 CNE fell by 54%.
Estimated Six Country post-1995 CNE were about 9.0 Gb (billion barrels) based on the 1995 to 2002 rate of decline in their ECI ratio. Actual post-1995 CNE were 7.3 Gb.
The key point is that a declining ECI Ratio corresponded to a rapid rate of depletion in remaining CNE, and even as Six Country production rose from 1995 to 1999, the rate of depletion in remaining post-1995 CNE accelerated, from 15%/year in 1996 to 26%/year in 1999.
Global Net Exports of oil (GNE). GNE, the combined net exports from the top 33 net exporters in 2005, fell from about 46 mbpd (million barrels per day) in 2005 to about 44 mbpd in 2012. Combined production from the top 33 net exporters in 2005 rose slightly from 2005 to 2012, but because consumption increased faster than production, net exports fell, as evidenced by the decline in the ECI Ratio.
The following chart shows the normalized values for production, ECI Ratio, net exports and estimated remaining post-2005 CNE (Cumulative Net Exports) by year (2005 values = 100%).
http://i1095.photobucket.com/albums/i475/westexas/Slide14_zpsbd9a272e.jpg
Based on the 2005 to 2012 rate of decline in the Top 33 ECI Ratio, I estimate that remaining post-2005 Global CNE fell by about 21% by the end of 2012. As noted above, this methodology was too optimistic for the Six Country Case History, in regard to estimating post-1995 CNE.
Preliminary 2013 update
Based on the preliminary EIA data for 2013, estimated post-2005 Global CNE (Cumulative Net Exports) fell sharply, from 530 Gb to 440 GB, partly because of production disruptions in some exporting countries, e.g. Libya. The annual volume of GNE fell from 46 mbpd in 2005 to 43 mbpd in 2013.
However, as noted above, the preliminary CNE estimate for the Six Country Case History was too optimistic, and supply disruptions may increasingly be more common in the years ahead.
In any case, based on the 2005 to 2013 data, remaining estimated post-2005 Global CNE fell by 29% from 2005 to 2013, as we burned through about 128 Gb of GNE in 2006 to 2013 inclusive.
To clarify slightly, based on the 2005 to 2013 rate of decline in the (2005) Top 33 net exporters’ ECI Ratio (ratio of production to consumption), estimated post-2005 global CNE (Cumulative Net Exports) were about 530 Gb. This estimate was based on the ECI data for the net export peak + 7 years. For the Six County Case History, estimated post-1995 CNE at net export peak + 7 years were 9.0 Gb.
Based on the 2005 to 2013 rate of decline in the Top 33 ECI Ratio, estimated post-2005 global CNE fell to 440 Gb*. This estimate was based on the net export peak + 8 years. For the Six County Case History, estimated post-1995 CNE at net export peak + 8 years were 7.5 Gb (actual post-1995 CNE turned out to be 7.3 Gb).
*EIA data show that the Top 33 ECI Ratio fell from 3.75 in 2005 to 3.10 in 2013. This is roughly equivalent to a declining income to expense ratio. At an ECI Ratio of 1.0 and at an Income to Expense Ratio of 1.0, net exports and net income respectively hit zero.
Should read: To clarify slightly, based on the 2005 to 2012 rate of decline in the (2005) Top 33 net exporters’ ECI Ratio (ratio of production to consumption), estimated post-2005 global CNE (Cumulative Net Exports) were about 530 Gb.
there have definitely been some signs of flat to lower oil demand in China, but one variable that is hard to quantify is an increase or slowdown in the rate that they are putting oil into their strategic reserve. Of course, the market doesn’t differentiate between a barrel bought for storage versus a barrel bought for consumption
It doesn’t have to. If oil demand is flat or lower, then *any* level of filling of storage would only reduce that demand figure further, and make a decline in Chinese consumption even steeper.
Much of Chinese commodities consumption has been related to the one-time overbuilding of infrastructure and real estate. That level of capital investment has to come to an end, and sharply reduce Chinese commodity consumption, including oil.
Auto sales are up 15% there this year, Nick.
Chinese VMT per vehicle is very low, and fuel efficiency is substantially higher than US. AFAIK passenger vehicles consume a small portion of Chinese oil consumption. AFAIK much of Chinese oil consumption is diesel, used to supplement the grid for manufacturing power.
Have you seen any good analysis of the composition of Chinese fuel consumption? That would be very, very useful.
None of Singapore, Hungary or Russia today could be considered full democracies.
When has governance in any of these countries been even close to fully democratic?
I am distinguishing the process of selecting a government, for example by democratic vote, from the quality of the actions of that government, that is, the quality of governance. These are two different things. India and Norway are both democracies. Governance in Norway is excellent; it’s terrible in India.
In China, Xi has indicated that he’d like to follow the Singapore model, that is, using a process of selecting government is not fully democratic; but delivering excellent quality governance. That’s why an FAA matters: it focuses on improving the quality of governance, not on the process by which decision-makers are chosen.
My concern is that Xi is confusing the process of selecting representatives with the quality of governance, ie, that an authoritarian regime is permitted the trampling of private property rights. That’s the simple read on base construction at Fiery Cross. That’s a Russian (Hungarian) , not a Singaporean, interpretation of governing. For China, this matters a lot. With bad governance, China could easily fall to a much lower growth path, say 4%, rather than 7.5%. It’s the difference, for example, between governance in Hungary and governance in neighboring Slovakia.
China looks like 6.5% growth is on the horizon, and I’ve expressed my reservations about the top line figures as they are. In any event, which direction China takes matters whole lot for, say, oil markets over a period of several years. If you want it in ideology terms, it’s whether a (classically) liberal or socially conservative objective function dominates decision-making there.
Thanks for the link, Jeffrey.
Here’s the thing with shales. In a supply-constrained model, the price signal is pretty consistent–above $100 Brent. Thus, if you’re marginal cost is below this level (or you can convince investors of it), then you have an incentive to expand production at an increasing pace until you either i) collapse oil prices or ii) run out of places to drill. Our assumption is that the latter is more likely. Now, if I look at PIRA or BENTEK or EIA data, there’s kind of an assumption that we get to a steady-state plateau after the shales hit a peak around 2016/2017. But I’m not convinced that the model works that way from a behavioral perspective.
If I’m EOG, and I have appropriate price signals, I will continue to expand my production at any increasing pace until I hit a constraint, which could be price, cost, infrastructure or logistics. Infrastructure (pipes, trains and drilling rigs) can be overcome. Logistics (like land acquisition) may be possible to overcome. The extent of “sweet spots” (and hence the cost outlook) is not entirely clear, but it’s possible that can also be overcome, at least for a while. Therefore, there seems to be a non-zero probability that, while EUR estimates may be largely correct, production is brought forward, followed by a resounding crash. It’s the “model rocket” model. Fast up, sharp down.
We’re pretty close the edge as it is. As I note above, if NA production growth can be increased to 2.5 mbpd / year from the current 2.0 mbpd / year, and assuming that OPEC does not move to offset it, then you could see substantial and rapid weakness in the oil price. A supply-constrained model suggests that there is a cliff. (I’d add there’s also the matter of latent / pent-up demand, which could offset such a supply surge. More on that in the next three weeks.)
On the other hand, I think there is very substantial supply sensitivity to weak oil prices at the 6-12 month horizon.
So it’s a very complicated world out there just now. And we’re not even talking about Iraq, Libya or Russia–all of which could throw a major wrench in the works.
However, if the “model rocket” model is correct, then that combined with the fall in conventional production could see a rapid collapse in the oil supply (depending on the international shale outlook), perhaps late in the decade.
“Fair value” of the Euro is about 1.21 – 1.25 Dollar. The CIA world factbook claims 1.19
That the exchange rates goes back to more normal, but has the Euro still overvalued by about 8%, that should scare me?
Looking at 30 year rates, like US ^TYX, compared to the whole German debt table in a 7849 byte pdf (http://www.deutsche-finanzagentur.de/fileadmin/Material_Deutsche_Finanzagentur/PDF/Aktuelle_Informationen/kredit_renditetabelle.pdf)
including maturity date, coupon, pre and post yield, ISIN number to trade with, … the whole nine yards,
I see people willing to pay a front up fee of 8%, and a yearly storage fee of 3.21 – 1.94% = 1.27% for their worthless green cash over the next 30 years : – )
Menzie ,
Does this mean you have finally admitted defeat on your monetary policy is ineffective at the zero bound contention?
Jeff: I am confused by your question. When have I ever asserted that monetary policy is completely ineffective at the zero lower bound? Please provide a link to the statement.
I do have lecture notes where I show how in a simple IS-LM model, with a liquidity trap, monetary policy is ineffective; but then in the other lectures (available to all in powerpoint slides), I spend (a lot of) time discussing the efficacy of credit easing and forward guidance.
In addition, I have previously written several times on the efficacy of unconventional monetary policies, on this blog, and in this BIS working paper.
Could you perhaps be confusing me with somebody else?
I have questions about the first two links.
Would you be willing to answer them? Thanks!
Jim and I are in US News and World Report:
http://www.usnews.com/news/articles/2014/09/03/new-oil-discoveries-appear-headed-for-new-low
@Steven @Prof. Jim, at recently concluded ONS in Stavanger, Norway, there was huge discussions around Climate Change and that Norway should get out of Oil sooner than later. For example, http://www.cicero.uio.no/webnews/index_e.aspx?id=12053. The propaganda (I use this word since most of the information was cherry-picked rather than providing the complete picture) has since ebbed. So are the Climate change policies going to affect the supply and when? http://www.nature.com/nclimate/journal/v4/n7/full/nclimate2270.html
Whatever happened to global warming?
This from Prof. Mark J. Perry, an Economics Professor.
Perry isn’t really a reliable source.
Climate Change is real, and a serious risk. That’s what scientists in general tell us. Look at the statements of every major professional scientific association: climatologists, physicists, geographers, etc., etc. Even the American Association of Petroleum Geologists is willing to say that “AAPG supports reducing emissions from fossil fuel use as a worthy goal.”
Nick, it is going to another very long and cold winter…
The fact is, that the World Wide Global Warming Warning conspiracy has failed
and is in the process of collapsing.
As for the EuroBanko, it’s EuroZero policy is going to fail, just like FedZero and
the NipponZero did..
The tragic conclusion one could reach, is that Central Bankers by and large are
just clones of each other; instituting policy because any action is better than none
at all.
If one examines all of America’s business cycles, you will see no difference since
the establishment of the FRB…
But again, it is better to have agencies than not…After all, today’s Americans could not
manage their affair without likes of DOEd; DOEn; EPA; FRB; FEMA; and DHS.
What is certain, if you have no answer then either the FRB or these governmental unit
agencies will!
After all, if enterprises can not drive the economy upwards – certainly our just and noble
FRB will…Not only are they lenders of last resort (Jackson Hole), but also the Omega economy
responders.
World Wide Global Warming
Well, for instance, the classic hard science is physics. The physics profession, in general, agrees that Climate Change is a serious risk.
The American Physical Society “the leading voice for physics and an authoritative source of physics information for the advancement of physics and the benefit of humanity”.
Their current statement about Climate Change is as follows:
“The evidence is incontrovertible: Global warming is occurring. If no mitigating actions are taken, significant disruptions in the Earth’s physical and ecological systems, social systems, security and human health are likely to occur. We must reduce emissions of greenhouse gases beginning now.”
That’s a strong statement.
See http://www.aps.org/policy/statements/07_1.cfm
Mário Assis Ferreira, Director of “Selfish”, writes in an editorial: “I do not know if it was a revolution, a coup or a military uprising. I do not know if, just as it was a dying regime, exhausted himself in atonement dropping the mere sight of a “Chaimite.
This type knows nothing but make collective redundancies is with him, when the best deal is to stay in the family, and is still sanding to those who weave.
Let’s see what the difference between the Portuguese justice that disgrace the citizen who needs it as the case of 112 workers at Casino Estoril, the years pass and nothing and jihadist who cuts the head from a citizen saying is untrue.
Jihadist shows the world his righteousness bad or good.
The Portuguese justice doom citizen leading to poverty profiting as banks and governments to come together as a network and it can not prove the deaths caused by them.
‘Though the moon is further away than the earth, it is not as big.’
Discuss.
My goodness! Did Prof Hamilton post this or did Menzie?
It will be interesting how the ECB QE project turns out. The experiments now on going should provide fodder for many many PHD’s. That said, I am not sure those PHD’s will add clarification to our economic dilemmas.
http://www.ft.com/intl/cms/s/0/5a2356a4-f58e-11e3-afd3-00144feabdc0.html?siteedition=intl#axzz35dXPyN9s
That “A climate fix would ruin investors” is not a good reason to avoid dealing with reality.
Still, that headline certainly clarifies the conflict between one narrow sector of the economy, and the well-being of both the rest of the economy, and the health of the environment on which we all depend.
one also needs to recognize that a collapse of fossil fuel companies is not necessarily a catastrophic financial event. fossil fuels will be eliminated, but that energy source will also be replaced by renewable energy sources-and the companies that promote them. the exxon’s of the world can either diversify adequately into those new energy sources, or they can fall by the wayside. but capital investment will flow into the new companies positioned in the renewable energy framework. so some investors will be punished and others rewarded-really based on who invests in a more profitable future energy landscape.
This is not QE, this is a kind of conditional lending to banks. The eur 700b appears to be an estimate of the amount of this type of conditional lending, not an estimated increase in excess reserves.