Integration, cointegration and the evaluation of time series data for public policy analysis. As my first economics teacher said, “ya gotta be careful”.
Bruce Thompson at Urban Milwaukee’s Data Wonk writes:
…the data shows Gov. Walker has had little impact, positive or negative, on how the state grows jobs.
Dr. Thompson appeals to data (which is good and a vast improvement over a lot of commentary), and focuses on the ratio of Wisconsin to national nonfarm payroll (NFP) employment (the documentation is unclear, but my graph using NFP looks the same as his, so I’ll assume it’s the establishment series and not the household series he’s using). He then shows that a linear regression on the ratio over the Doyle years predicts well the evolution of the ratio in the Walker years. Here’s his graph:

My first published article (in 1991!) examined the implications of inadequately addressing issues related to unit roots in estimating relationships (Beware of Econometricians Bearing Estimates). Hence, I thought it relevant to examine the validity of Mr. Thompson’s approach in this context.
In fact log NFP in Wisconsin and in the US fail to reject conventional unit root tests. Moreover, the ratio of the two series (which is what Mr. Thompson uses) fails to reject the unit root null. In fact, so too does the log ratio.
Dr. Thompson is correct that Wisconsin NFP and US NFP are obviously related. The way to test for the relationship involving integrated series is to use cointegration methods. Applying Johansen’s maximum likelihood method, I reject the no-cointegration null. Hence, I estimate a simple single-equation error correction model with the growth rate of Wisconsin NFP as the dependent variable (I’ll assume the US series is weakly exogenous with respect to Wisconsin).
(1) Δnt = -0.0014 – 0.026×nt-1 + 0.018×nUSt-1 + 0.865×ΔnUSt – 0.282×Δnt-1 + 0.361×ΔnUSt-1 + ut
Adj-R2 = 0.53, SER = 0.0017, DW = 2.04, Obs.=216, sample 1994M01-2010M12. Bold face denotes significance at the 10% MSL, using HAC robust standard errors.
Using the DW statistic is not valid for assessing the presence of serial correlation when there’s a lagged dependent variable in the regression, but Q(12) and Q(24) tests fail to reject the no-serial correlation null.
The implied long run elasticity of Wisconsin to US NFP is 0.67; using the Johansen procedure (no trend in cointegrating vector, four first difference lags) yields a long run elasticity of 0.53, while DOLS(+2,-2) yields an estimate of 0.73. The maximum likelihood and DOLS estimates indicate one can reject the null that the elasticity is unitary.
Using the estimated error correction model (ECM), I dynamically forecast out-of-sample the Wisconsin NFP. The results, along with the 90% confidence intervals are shown in Figure 1.
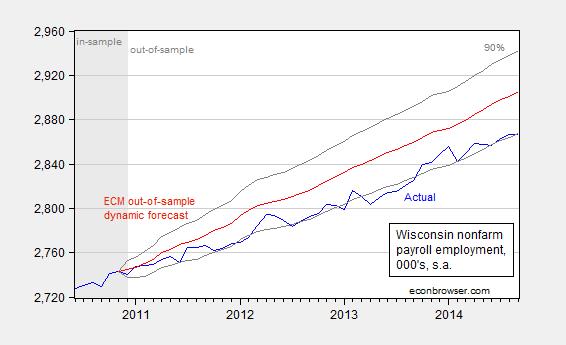
Figure 1: Wisconsin nonfarm payroll employment (blue), forecasted (red), and +/- 1.64 standard errors (gray lines). Source: BLS, and author’s calculations.
The graph indicates that based on historical relationships, predicted employment has been systematically higher than actual; as of 2014M09, the mean forecast is 37,000 higher. The gap between forecasted and actual is (borderline) statistically significant.
Hence, I think it Dr. Thompson’s finding that post-January 2011 Wisconsin employment is well predicted is subject to the spurious correlation critique. On the other hand, the fact that Wisconsin employment has lagged forecasted (using more appropriate econometric techniques) does not prove that the policies of the Governor are the source of the shortfall.
It is interesting that over a period that private employment has risen 5.1%, government employment has declined 0.8% (well, maybe not interesting — that was the intent of the Walker administration after all). Here is a scatterplot of the overall employment gap vs. government employment gap, where I used the a simple trend growth estimated over the 1994M01-2010M12 period (in log first differences) to forecast out the counterfactual government employment growth. Note that the decrease in government employment is associated with a decrease in employment (both relative to counterfactual).
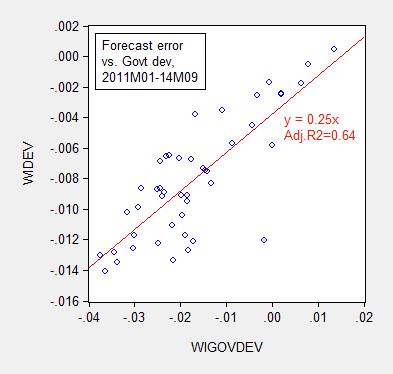
Figure 2: Wisconsin employment gap vs. government employment gap (blue circles), and fitted regression (red), over 2011M01-14M09. Counterfactual government employment estimated using log first differences on constant over 1994M01-2010M12 period. Source: BLS and author’s calculations.
Even if one doesn’t believe that government spending cutbacks are the source of the lagging employment growth, what is true is that stagnant economic growth, arising from conjoined tax cuts and even larger spending cuts, was entirely predictable from conventional theory, as discussed in this February 2011 post.
Update, 10/24, 6pm Pacific: See this article by Mike Ivey at the Capital Times; particular attention should be paid Dr. Dresser’s analysis.
This post would appear to have more basis in reality than “it’s all on Walker.” As I commented in the recent post about Wisconsin’s employment performance, Wisconsin would appear to be about average compared to the Midwest Census Region’s employment record over the past 10 years. The real driver or drag on economic performance would appear to be national policies including taxation, stimulus spending, regulation, and welfare… each of which affect various segments of the workforce and, more importantly, employers differently.
There seems to have been a generous amount of spending directed at both the lower economic strata and the higher economic strata, but the middle has languished because they continue to bear the brunt of higher costs of education, food, and healthcare while employers are encouraged by taxes, regulation, and policy to seek to cut the traditional middle… the group that historically grows the employment numbers… out of the equation through outsourcing and automation. Those are not single state dynamics, those are national dynamics. http://www.tradingeconomics.com/united-states/productivity
What it boils down to is that during this decade the poorly educated and unemployed have been increasing subsidized in the current decade; corporations have become adept at doing more with less and avoiding the reach of the tax man through globalization; the so-called middle class has seen employment opportunities dwindle, savings earning have become non-existent, and pressure mounting from special interest groups to claim priority in employment and other considerations. Yet, ironically, the very federal government politicians who have had the power to address this over the past 6 years have simply exacerbated the problems.
An interesting segment aired this evening documenting the economic tensions in San Francisco with special condemnation of the economic injustices occurring because of the success of the Silicon Valley companies coming from none other than Nancy Pelosi. That’s some special gall considering she is the party of power around there. She has been one of the beneficiaries of the government largess that has created the largest gulf between the elite and others in an area that now pits the elite Democrats against the non-so-elite Democrats… while she tries to deflect the blame to the party out of power.
So, yes, this is a reasonable article about Wisconsin. Some of the praise/blame belongs to Gov. Walker, but the reality is that it is the Pelosis of the federal government that have enabled an ever widening rift between potential and achievement. Can’t you just imagine the statements that will come from Nancy, et al when McDonalds automates its stores in response to $15 per hour minimum wages? You push the balloon in one spot and it bulges in another.
It’s not spending cuts, which really haven’t happened as much as future spending budget growth growing more slowly, as it is mangling of the marketplace by massive government intrusion and distortion that has made this an agonizingly slow employment recovery.
@ Bruce Hall
There may or may not be an inclination to “cut the traditional middle,” but I’ve seen no indication such a dynamic results from contemporary government policy. Champions of laissez-faire should familiarize themselves with the CBO report ‘Trends in the Distribution of Household Income Between 1979 and 2007.’ One of the interesting factoids contained therein is that since 2001, the middle quintile of household earners has received, on average, more in federal transfer payments than it’s contributed in taxes. For said earners, net transfers increased from -$2,244 in 1979 to $1,151 in 2007 (+$3,395). The comparable figures for the second quintile and top 1% were $2,588 to $4,128 (+$1,540); and -$49,084 to -$94,814 (-$45,730), respectively.
Over the same period, market income has grown 14% for the middle quintile, 16% for the second quintile, and 110% for the top 1%. Which suggests that the stagnation of middle class incomes is rooted not in government policy, but market dynamics. Should proponents of the free market find this surprising? Is there some tenet of classical economics that suggests income growth will be uniform and equitable? If not, what’s the motivation behind blaming the government — do you find this trend problematic?
I wouldn’t be surprised, since the federal government has spent trillions of dollars more than it collected in taxes.
However, I can’t think of any “transfer payments” I receive.
I know, I work very hard and live too poorly, for all that work, here in California.
Menzie Chinn is talking about a cyclical phenomenon, while Bruce Hall is talking about a structural phenomenon.
Government spending raises growth, when the country is below full employment, because even if government pays people to dig holes and fill them up again, they’ll have income to buy goods & services from workers creating valuable goods. Therefore, more workers will be hired to create those valuable goods.
Chicken or egg McMurphy; chicken or egg? Has the top echelon grown in wealth while the middle relatively stagnated because of the market or because of the market as distorted by government policies? That’s the heart of the debate. I find it problematic because I find that government policies have distorted the employment market as much as technology or greed. Banks have become gun shy from “stress tests” to the extent that they simply sit on money rather than extend “risky” loans to business. That inhibits economic growth and that inhibits employment growth. Is that a greed problem or a policy problem? Similar issues abound in tax policy and regulations. Fix the federal government and economic problems resolve themselves in the marketplace.
Bruce Hall: Your statement:
verges on the delusional.
Were there bank panics before the advent of bank regulation in the 1930’s? Hmm, questions, questions. Was income inequality high in the Gilded Age (gee, wonder why they called it that?). Was Upton Sinclair’s “The Jungle” a work of fiction?
I recommend you pick up Varian’s graduate textbook, and read the assumptions for the first and second welfare theorems.
I don’t think I said “eliminate” the Federal government, but if you think the Federal government promotes efficiency and effectiveness or anything close to “optimal distribution of income” as it presently operates and impinges on the marketplace, then I would mirror back the delusional comment.
Bruce Hall: Fair enough — although I suspect your definition of “fix” is substantially different than my definition of “fix”, especially given the thrust of the comment about “distortions”.
University of Minnesota
Welcome to the Minnesota Daily Classifieds!
it’s not too late to change directions!
It is always interesting to see people blame these poor trends for the US that have been in place since at least 1980 and also in other advance economies on the current administration.
I’m still waiting for someone to explain how business fears of Obama’s policies caused small business formations to weaken over the last 30 to 40 years.
While the trends between MN and WI look alarming when looking at the raw numbers of jobs, when we decompose the job statistics we get an even more troubling view and evidence that pins a good portion of the blame squarely on Wisconsin’s Neanderthal GOP. Interestingly the total numbers of goods producing jobs are fairly close (41,000 MN to 49,000) but MN percentage gain in this coveted category leads WI over the 01/2011 – 09/2014; 10% to 9%. The gap between job creation is primarily due to the more than 50,000 additional service jobs that MN added when compared to Wisconsin. The majority of these additions are in health care (35,000) and I would presume some of that to be the impact of Medicaid expansion, an expansion expressly and pointedly refused by Walker.
But here is the truly strange thing. Minnesota actually cut state government employment over this time period by 2,000; while anti-government, union-thug bloviator Walker ADDED nearly 10,000 state government positions during the same time period. (Now that I’ve got your attention there was a statistical fluke at year-end 2010, averaging the monthly numbers around that time, you find that Walker added 3,000 to 4,000 state workers; still for a budget-slashing, government-hating, hole-digger you have to admit–he should take some lessons from the state’s western neighbor–I would probably look at the bloated Corrections Dept.–MN spends less than half of what Wisconsin does in the area.
The 39,000 person gap in estimated employment would likely be lower if the state’s that realized a lot of oil/gas employment growth were taken out (Texas, North Dakota, Colorado, Pennsylvania) of the US numbers that the Wisconsin numbers were regressed against (because Wisconsin does not have economic O&G right now).
Once you have an accurate number, let’s say it is 39,000 for now though, one would weigh that, which is a cost, against the benefits of spending less on government services that may not have been needed and the benefits of more people having more of the money they earned in their pockets. Fortunately, in the US it is easy to do that as voters will easily be able to choose a different governor in the future if they percieve that things are better off now than they were before.
Spencer,
Have you ever looked at the index of economic freedom? The US was numbere 2 in the world in 1992. Today the US is number 12. We have been falling while other countries have been rising. Chile is a good example now at number 10. The US has fallen in every category except sound money, and that is only because of low inflation acutally caused by the recession. The growth of the central government in the US plus the shift to administrative rather than constitutional government has been a strain. Add to that the tax structure that is moving startup companies overseas and the difficulty of starting a business and it is pretty obvious why.
Well, Chile is now ruled by people who are simpatico with Menzie’s politics, so expect their EFR to decline. Also, just in from China;
http://blog-imfdirect.imf.org/2014/10/23/does-raising-the-minimum-wage-hurt-employment-evidence-from-china/
‘While China instituted a minimum wage system in 1994, enforcement of compliance with the law was significantly tightened only in 2004; the results described below are based on post-2004 data.
‘So what does the evidence show? On average across all firms, we find that an increase in the minimum wage leads to a small decline in employment: a 10% percent increase in the minimum wage lowers employment by a little over 1% percent.
‘The impact differs across firms, being greater in low-wage firms than in high-wage firms.’
It takes a Phd in econ to write that last sentence?
Patrick R. Sullivan:
I am still waiting to hear you admit you were in error regarding depth of the downturn in Canada vs. US during the Great Depression. As you recall, you stated unequivocally:
And this statement is wrong.
So, how much of that small increase in wages was spent and how much was saved?
The purpose of a higher minimum wage is to increase real economic growth, through consumption and productivity.
If you want to increase employment, instead, you can pay people to dig holes and fill them up again.
A higher minimum wage will cause weak or poorly managed firms to lose business or fail.
However, stronger or better managed firms will gain their business.
And, if the higher wage is spent, they’ll also gain from the increased demand.
A minimum wage that’s too high or too low is suboptimal.
And, China is not the U.S..
MMMMM? Index of economic freedom? Heritage Foundation is not a great source of data. I seem to recollect how they predicted super low unemployment figures when rating a Republican proposal. Much laughter ensued.
Menzie,
I am working through your 1991 paper and the formula in this blog. I am using the methodology to estimate commodity consumption and have a quick question for you.
My initial unit root tests show that the dependant variable has a unit root (at 10% but not 5% or 1% CI), but the independant variable does not. Am I allowed to take a “better safe than sorry” approach and use first difference and lagged level methdology (as your formula in this blog does) anyways? Despite both variables being close to I(0) or actually I(0)?
Apologies if this does not make sense. Thanks!
Anonymous: That paper is 24 years old, and methods have advanced, so this is not the best exposition. But here’s my thoughts for what it’s worth.
Not sure I understand the characterization of the dependent variable — did you fail to reject at 5% and 1% msl, but rejected unit root null at 10% (unit root is null for DF, ADF and DF-GLS; trend stationarity is null for KPSS)?
If you rejected difference stationary null at 10% msl for both, then I’d go with assumption of stationarity, and estimate in levels; just make sure degree of serial correlation is not too high (Granger’s rule of thumb is DW should be above R-squared in the levels regression). Likely you’d have serial correlation of substantial degree so use Newey-West HAC robust standard errors.
First differencing gives you a relationship in growth rates (if the variables are logged). OK, but if you want the relationship in levels, I’d go with the levels specification, with the above caveats.
Ender’s textbook is very good on this subject.
Thanks for the quick response! And apologies for the confusion, it has been a while since I was in grad school.
In the second paragraph of your response you said “If you rejected difference stationary null at 10% msl for both, then I’d go with assumption of estimating in levels…”; in my model, however, the null was rejected for the independent variable, but not the dependent variable. Since one is integrated and the other is not, can I assume that they both are integrated and do a regression similar to yours above? Or will this cause the model to be less robust and I should therefore just regress based on the levels?
Again, apologies for the confusion, I am an amateur econometrician at best.
Anonymous: I see. I’d either run the regression in levels assuming both series are I(1), thinking of the regression as a cointegrating regression (so you’d need to test for cointegration using either the Engle-Granger method or Johansen), or in first differences with lags. Parameters in the cointegrating regression are super-consistent (if the variables are cointegrated), but can still be quite biased in small samples, so DOLS or Johansen ML is to be preferred.
Alternatively, you’d be safe to run an error correction model. If there is really no long run relationship, then the coefficients on the error correction term will all be zero.
Hope that helps.
Awesome – that helps a ton! Thanks again for the quick response.