That’s the message from the BLS today.
Figure 1 shows that employment is growing, as measured by a number of indicators.
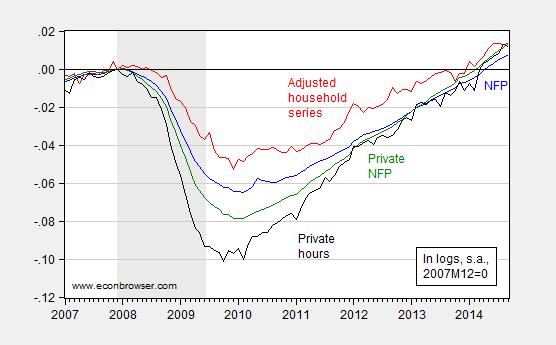
Figure 1: Log nonfarm payroll employment (blue), household series adjusted to conform to NFP concept (red), private nonfarm payroll employment (green), and aggregate weekly hours in private sector (black), all normalized to 2007M12=0. NBER defined recession dates shaded gray. Source: BLS via FRED, BLS, NBER, and author’s calculations.
Notice further that revisions have typically been to the upside in recent months. August figures were revised upward by 69,000. This is shown in Figure 2.
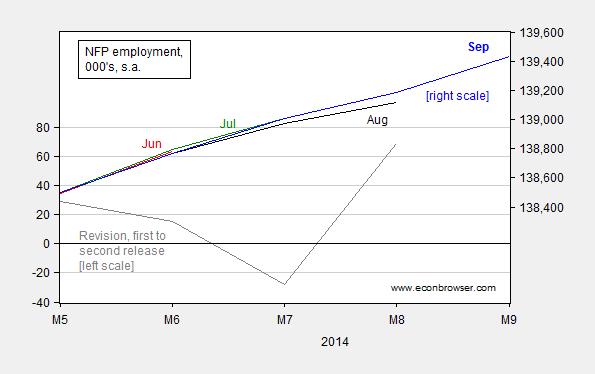
Figure 2: Level of nonfarm payroll employment from June release (red, right scale), July (green, right scale), August (black, right scale), and September (blue, right scale), and revision from first to second release (gray, left scale), all in thousands, seasonally adjusted. Source: BLS via FRED, and author’s calculations.
One interesting point is that the labor intensity of GDP, as measured by the (log) ratio of NFP employment to real GDP has been growing more rapidly than in the preceding recovery. That is, while the ratio of employment to GDP continues to decline, the rate of decline has decelerated. This observation is illustrated in Figure 3.
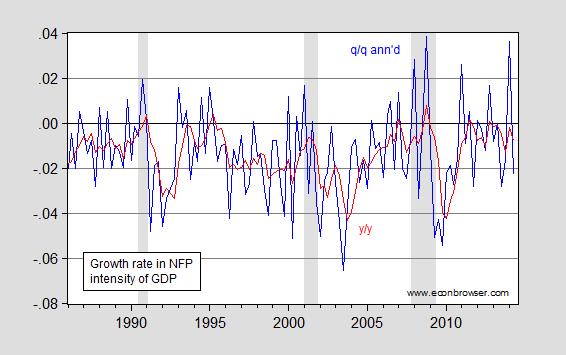
Figure 3: Growth rate in employment/GDP ratio, q/q annualized (blue) and y/y (red). NBER defined recession dates shaded gray. Source: BLS and BEA via FRED, NBER and author’s calculations.
Of course, while the pace of employment growth has risen with output growth, the sharp drop in employment in immediate wake of the recession means that employment has caught up with that implied by the long run relationship between employment and output, as discussed in this post (the paper, with Laurent Ferrara and Valerie Mignon, is now published at Journal of Macroeconomics). That is, it’s important to remember the level as well as the growth rate, something that people sometimes forget (they know who they are). Hence, this report should not be taken as carte blanche for a rapid increase in the policy rate.
Using the correlation between log first differences between output and employment over the last eight quarters (R2 = 0.16), the implied growth rate for 2014Q3 is 3.2% (SAAR), slightly higher than Macroeconomic Advisers latest tracking estimate at 2.8% (updated to 3.3% at 7pm Eastern).
For more on the employment release, see Furman/CEA, McBride/CR, Madigan/WSJ RTE, Portlock/WSJ RTE, and Stone/CBPP
Yes, no sec-stag…
“This time” is always different, except in the end it never is…It was just a massive recession that was reinforced with pro cyclical policies, especially at the state level, and therefore took a long time to come back. Econ 101…
Menzie’s heading is some kind of cruel joke. While it is reported that the economy added 232,000 jobs labor participation fell by 315,000. Only in government accounting can an increase in those working be seen as a decrease in unemployment. The participation rate has fallen to the same level as the Carter administration when the method of calculating unemployment showed it to be double digit (again the wonders of government accounting).
This labor report is simply another cynical reinforcement of why the citizens of the US have lost faith in their government. People are not even listening any more.
From reports on Ebola to reports on the destruction of radical Islam the facts show the rot behind the white-wash.
Ricardo noted: “labor participation fell”
Oh, my. Thanks to Obama’s misguided policies, the labor force participation rate has been falling since 2000. The negative impact of his policies on the participation of men reaches back even farther; he has made their participation rate drop since the late 1950s.
The decline could be reversed by a simple policy of killing people as they age past peak participation age brackets. Also, closing large numbers of colleges and universities would boost participation rates for younger citizens.
The factors you mentioned are certainly relevant to the LFPR. And, these factors are well known to the folks at the Bureau of Labor Statistics.
Every two years the BLS, based on demographic and other factors, estimates the LFPR ten years into the future. Back in 2005, the BLS estimated the 2014 LFPR and took into account the factors you mentioned. Their estimate? It was that the LFPR in 2014 would be 65.6 percent. However, in September 2014 the LFPR was a mere 62.7 percent. Even for a 10-year projection (actually 8 years, but based on prior data) that’s a whopping difference. Your read is likely that rather than misguided economic policies, the BLS, taking into account the factors you just mentioned, just got their estimate wrong, and big time at that. Their estimate was not based on closing universities or killing folks “past peak age participation brackets”.
http://www.bls.gov/opub/mlr/2005/11/art3full.pdf (See Table 5)
I would have thought that given the severity of the recession and the abnormally slow recovery (job and otherwise), more people would *now * choose to stay in the labor force, if only they could, in order to restore their finances for retirement. It appears to me that failed economic policies are largely to blame for the low participation rate. I would also add failed regulatory policies to the mix.
Here’s a spreadsheet on US population, immigration, aging, labor force participation, employment and unemployment.
On the Analysis tab, you can see all the numbers together. You can fool around with those to see how jobs respond under varying assumptions.
http://www.prienga.com/blog/2014/10/3/employment-tables
I personally do not put excessive stock in labor force participation rates for other than demographic (age-related) reasons. This economy has plenty of dry powder if the trend lines are otherwise good. Assuming shale production remains strong and oil prices weak (there was a disturbing report on EOG out on Friday re: Eagle Ford production outlook), I would expect the US to have a terrific year next year for job creation.
viv darling
“Back in 2005, the BLS estimated the 2014 LFPR and took into account the factors you mentioned. ”
since nobody could predict the upcoming financial crisis in 2005, you really think it is fair to harp on bls for missing their 10 year projects, during which the financial crisis occurred? the boundary conditions changed so it is not realistic to expect any model to be successful moving forward from 2005.
“I would have thought that given the severity of the recession and the abnormally slow recovery (job and otherwise), more people would *now * choose to stay in the labor force, if only they could, in order to restore their finances for retirement. ”
what business would hire a laid off baby boomer today, one who is out of touch with modern technology and cannot keep up with the younger folks? most boomers recognize this and have taken appropriate paths forward, since they do not want to work for half the salary they once commanded.
of course, if you want to blame failed economic and regulatory policies, perhaps you should consider the conservative led economy that led to the collapse to begin with. a recovery would be unnecessary if conservatives had not tanked the economy in the first place.
Baffling,
We are talking about the LFPR: *not* the unemployment rate. The comment was in response to ottnott who seems to claim that this has everything to do with demographics and nothing to do with economic policy, much less the recession. Or, was ottnott wrong about that? It was also obliquely in response to a post heralding “robust employment growth”. Or, was Menzie wrong about that, too, in that the situation with overall employment *still* has everything to do with a recession that started nearly seven years ago and officially ended in June 2009?
Of course, the BLS would not have predicted a severe recession or a financial crisis. Nor, would they have any reason to predict the various economic policies that were adopted during such a financial crisis and recession and after they ended. But, that’s really the point: I would accept an argument that the BLS could not have predicted an *unemployment rate* during a recession *falling within 2014*. That recession ended *June 2009*. We should be back to trend. The BLS was tracking a trend that clearly included a sophisticated demographic analysis, including not only age demographics, but also the participation of women in the workforce etc. It is rather implausible to suggest that the answer to the low LFPR is a recession that ended more than 5 years ago and that it is entirely a prior administration’s doing. We should be back, by now, to the LFPR trend line they predicted in late 2006. We clearly are not. Not by a long shot.
“What business would hire a laid off baby boomer…”. I would suggest that would be a business that had enough confidence in the economy that it would view such a hire to be economically beneficial. And, if that business were to pass over the boomer for the reasons you state, wouldn’t they just hire someone else causing the unemployment rate (or even the LFPR) to also go down? The point here is that in order to judge the amount of slack in the labor force and any “robustness” in employment growth, it’s not sufficient to merely look at the unemployment rate.
By the way, that “darling” comment was really cute. But, do you really think that adds anything to the force of your argument?
viv baby,
superposition does not apply to the labor participation rate. if the previous administration had not tanked the economy, we would not have had any reason to lay off so many people, including technologically impaired boomers. but the economy tanked and those folks were laid off-and there is really no reason to hire them back. they were not value adding prior to the conservatives tanking the economy, but most businesses did not have a good reason to release them before bush gave them an excuse with a bum economy. but they certainly have an excuse for not rehiring those boomers-they are not value added at the same salary. but none of them will work for half salary, so they “retire” early. that is how the demographics changed the model quite a bit before and after the financial crisis-and not something the bls or anybody else could model very accurately.
“We should be back, by now, to the LFPR trend line they predicted in late 2006. We clearly are not. ”
i guess you need to better back up this statement. the economic and financial world operates much different from late 2006-in ways that were not predicable at that time.
vivian you are such a pretty woman that i hate to argue with you 🙂
Vivian wrote:
Menzie, I failed to use the formatting tags correctly, and hence left out the quotes I wanted to include from Vivian. Can you strike that attempt and instead include the one below. Thanks.
============================
Vivian wrote:
The factors you mentioned are certainly relevant to the LFPR. And, these factors are well known to the folks at the Bureau of Labor Statistics.
True, though their 2005 projection did not include a long recession, triggered by a financial crisis, beginning in 2007.
Vivian added:
Your read is likely that rather than misguided economic policies, the BLS, taking into account the factors you just mentioned, just got their estimate wrong, and big time at that. Their estimate was not based on closing universities or killing folks “past peak age participation brackets”.
No, I was just treating Ricardo with the lack of seriousness he deserves, hence my references to Obama policies causing trends starting in the 1950s and my suggestion that we could get the participation rates up with geriatricide and closure of many colleges and universities.
I wrote my comment already knowing what a recent Fed Reserve research paper had to say about the participation rate. It found that about half the drop from the pre-recession rate in 2007 is structural (primarily the aging population), a further portion likely (it was more difficult to model) due to trends affecting youth participation (loss of “middle-skill jobs leading to increased competition for low-skill jobs that often employed youths, and increased time spent in education). The authors believe that cyclical weakness accounted for 0.25-1.0 percent of the drop in participation rate.
http://www.federalreserve.gov/pubs/feds/2014/201464/201464pap.pdf
Vivian continued:
I would have thought that given the severity of the recession and the abnormally slow recovery (job and otherwise), more people would *now * choose to stay in the labor force, if only they could, in order to restore their finances for retirement.
Surveys support your thought. The Fed Reserve study noted “the unusually high level of those out of the labor force who want a job”. This fact argues in favor of continued dovishness on the part of the Fed.
Vivian concluded:
It appears to me that failed economic policies are largely to blame for the low participation rate. I would also add failed regulatory policies to the mix.
Clearly, the financial crisis revealed inadequate regulatory oversight, and one could point to (and two could argue about) economic policies before and after the crisis that made the recession worse than it had to be and the recovery slower than it could have been. For example, I consider it a huge failure that the “stimulus” package included so much of a supply-side element in a period of depressed demand and that there was so much emphasis on the short term that we blew a near-perfect opportunity to tackle a big chunk of the nation’s backlog of infrastructure repair and replacement.
Whatever the shortcomings were, something is working now. Calculated Risk notes that the US is on pace to add more private-sector jobs during Obama’s second term than were added in all but two Presidential terms (Clinton’s 1st and 2nd) in the Carter-through-Obama period. http://www.calculatedriskblog.com/2014/10/public-and-private-sector-payroll-jobs.html
Adjusted for population, the Carter and Reagan II terms probably are better than the current pace, but those terms were during a period of fast (about 3% annual) growth in the prime (25-54) working-age population, while that population has been flat in the Obama years. http://www.calculatedriskblog.com/2014/10/update-prime-working-age-population.html
ottnott,
Vivian neither wrote, nor added, nor continued, nor concluded most of the things you claim she did.
Uh, oh. Danger ahead. Ricardo is attempting to do math again.
Ricardo says that labor participation fell by 315,000. He computed this incorrect number by subtracting the monthly change in “Not in labor force” on line 8 in Table A-1.
That is not the labor participation change. From line 2 of Table A-1 you can see that the correct number for labor participants declined by 97,000, not 315,000. Not good, but less than a third of Ricardo’s bogus number.
All other things equal, the “not in labor force” number always increases because the population increases by about 200,000 per month and roughly one-third of them are not seeking jobs, either because the are 16-year-olds in school or take time off to raise kids or retire at 65. The change in “not in labor force” is not equal to the change in labor participation.
If it’s Ricardo, and it involves numbers, you can just assume it’s wrong.
International comparison of employment-to-population ratios: http://www.prienga.com/blog/2014/10/6/employment-to-population-ratios
You find more detailed data on LFPR of the G7 countries on the site of the German IZA (in English):
http://www.iza.org/en/webcontent/charts
Labor Policy -> Facts & Figures
The much higher LFPR in Germany is a result of more women in the workforce and a much lower tendency to retire early, the latter a consequnce of the Hartz reformes.
Thanks for this. I think France is the interesting case. Basically, to the extent its labor force participation rates hold up, they are due to the high degree of participation by women in the marketplace.
US policy since 2008 looks terrible. Wrong direction for just about any segment you care to pull.
vivian wrote:
ottnott,
Vivian neither wrote, nor added, nor continued, nor concluded most of the things you claim she did.
Presumably you are responding to my 11:58 post, which, as you note, attributes statements to you that you didn’t write.
As explained in my 12:06 post, an error in my use of html tags erased your quotes and left only my writing. The 12:06 post has the corrected version with your quotes in place.