The EIA released a new drilling productivity report last week, allowing us to update our graph of the drilling rig count in the four major tight oil regions. Active rigs in those areas are now 32% below their peak last October, the lowest level in 3 years.
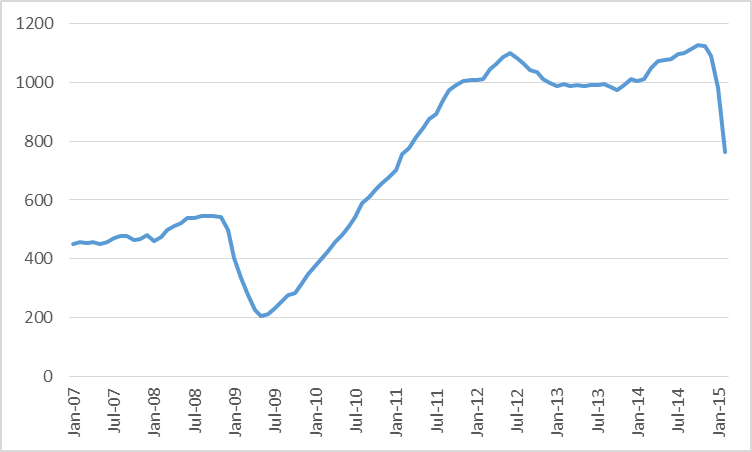
Combined oil rig count for Permian, Eagle Ford, Bakken, and Niobrara, January 2007 to February 2015. Data source: EIA.
The DPR’s forecasting model nevertheless predicts that production from these four regions will be half a million barrels/day higher this month than it was in October, and will only begin to decline starting next month.
But folks over at the Peak Oil Barrel note that while the DPR is estimating for example that Bakken production rose 27,000 b/d between December and January, the North Dakota Department of Mineral Services reported last week that Bakken monthly production was down over a million barrels in January, or about a 35,000 b/d drop from December.
In any case, U.S. crude oil inventories continued to increase last week, signaling that so far supply continues to outstrip demand. And the Wall Street Journal reports a strategy followed by some companies that could enable them to bring production back up quickly if prices recover:
Now many are adopting a new strategy that will allow them to pump even more crude as soon as oil prices begin to rise. They are drilling wells but holding off on hydraulic fracturing, or forcing in water and chemicals to free oil from shale formations. The delay in the start of fracking lets companies store oil in the ground in a way that enables them to tap it unusually quickly if they wish– and flood the market again.
The backlog of wells waiting to be fracked– some are calling it fracklog— adds to the record above-ground inventories to restrain any significant price resurgence. Eventually, however, the economic fundamentals have to prevail, and we will settle down to a price around the true long-run marginal cost.
The 2020 WTI futures contract closed at $67/barrel last week. But today North Dakota’s Williston Basin Sweet is fetching less than $29/barrel.
Or the contracts require drilling to keep leases.
https://www.dmr.nd.gov/oilgas/presentations/FullHouseAppropriations010815.pdf.
And a rig today is not the rig in 2007. So, this graph isn’t an apples to apples comparison.
The WSJ brings up something I was going to, and I bet it explains the difference between the DMR and EIA.
About half the cost of a fracked Bakken well is the frac job, drill rigs are typically under long term contract which are slowly expiring by the month, but the equipment leased for frac jobs is typically on a shorter timeframe. Some drilling is also necessary to hold land leases. Increasing stringency of DMR requirements on gas flaring also are delaying some completions.
If anyone is interested in my 2¢ worth on this general topic, I have a number of comments on the prior article on US oil production:
https://econbrowser.com/archives/2015/03/u-s-oil-production-still-surging
However, I posted something that I found very interesting, at the bottom of the prior thread. Earlier this year, Steven Kopits’ staked out a pretty lonely position regarding the outlook 2015 supply and demand (total liquids basis), and I thought it very interesting that Art Berman has an article on increased consumption that is quite supportive of Steven Kopits’ (January, 2015) article on supply less demand:
http://www.artberman.com/world-oil-demand-surges-a-data-point-for-price-recovery/
World oil demand increased by 1.1 million barrels per day in February
Steven Kopits’ (January, 2015) outlook for global supply less demand:
Supply Minus Demand, Explained
http://www.prienga.com/blog/2015/1/20/supply-minus-demand-explained
Having noted Steven Kopits’ continuing track record of being remarkably prescient regarding global oil supply and demand analysis, I do have one issue with global supply & demand analysis–consumption in net oil exporting countries versus consumption in net oil importing countries, to-wit, to paraphrase “Animal Farm,” in my opinion some consumers are more equal than others.
Let’s assume a scenario where all oil production and refining operations are in oil exporting countries and let’s ignore things like refinery gains. Total petroleum liquids production is 80 mbpd and consumption in the oil exporting countries is 40 mbpd, and they therefore net export 40 mbpd to oil importing countries.
Production rises by 2.5 mbpd in the oil exporting countries, so total supply increases from 80 mbpd to 82.5 mbpd. However, consumption in the oil exporting countries rose by 5 mbpd. So, Net Exports = Production – Consumption = 82.5 mbpd – 45 mbpd = 37.5 mbpd.
My point is that a global supply and demand analysis would not accurately represent the situation in the net oil importing countries, i.e., a 6.25% decline in the supply available to net importers (40 mbpd to 37.5 mbpd), although global supply is up by 3.125%, 80 mbpd to 82.5 mbpd.
Of course, the crux of what I call “Export Land Model” or ELM, is that for a number of reasons (subsidies, proximity to production, legal restrictions, etc.), consumption in oil exporting countries tends to be satisfied before oil is exported.
Interesting enough, the case histories tend to show that regardless of how oil exporters treat internal consumption, given an ongoing production decline, the net export decline rate tends to exceed the production decline rate and the net export decline rate tends to accelerate with time.
For example, Indonesia subsidizes petroleum consumption and the UK heavily taxes petroleum consumption, but both former net oil exporters showed accelerating rates of decline in their net exports (in excess of their respective production decline rates).
Here are the ELM Mathematical Facts of Life:
Given an ongoing production decline in a net oil exporting country, unless they cut their domestic oil consumption at the same rate as the rate of decline in production or at a faster rate, the resulting net export decline rate will exceed the production decline rate and the net export decline rate will accelerate with time. Furthermore, a net oil exporter can become a net oil importer, even with rising production, if the rate of increase in consumption exceeds the rate of increase in production, e.g., the US and China.
The (2005) Top 33 net exporters showed a slight increase in production from 2005 to 2013, from about 62 mbpd to 63 mbpd (total petroleum liquids + other liquids, EIA), but their rate of increase in consumption exceed their rate of increase in production and their combined net exports (what I call Global Net Exports, or GNE) fell from 46 mbpd in 2005 to 43 mbpd in 2013.
Furthermore, China and India (“Chindia”) consumed an increasing share of a post-2005 declining volume of GNE. What I call Available Net Exports (ANE, or GNE less Chinidia’s Net Imports, CNI) fell from 41 mbpd in 2005 to 34 mbpd in 2013.
Here’s the Available Net Exports problem:
Given an ongoing decline in GNE–and it’s when, not if–then unless the Chindia region cuts their oil consumption at the same rate as the rate of decline in GNE, or at a faster rate, the resulting rate of decline in ANE will exceed the GNE decline rate and the ANE decline rate will accelerate with time.
From 2005 to 2013, GNE fell at 0.8%year. From 2005 to 2013, ANE–the supply of Global Net Exports of oil available to importers other than China & India–fell at 2.3%/year.
“we will settle down to a price around the true long-run marginal cost.”
I know nothing about this stuff, can you tell me what you think is the true long-run marginal cost? Is the $67/barrel futures number close to it in your opinion?
xo: I think $75 is a better estimate, though I second-guess the market only with trepidation.
If you do the supply-demand pairs, the resulting graph suggests that it will be quite difficult to hold the price below $85 Brent over the long run. This appears to be above the marginal cost for shales, but it’s important to keep in mind that the relevant measure is system-wide marginal cost, not just that of shales.
Much below $80 Brent, conventional supply falls off and demand grows, and shale growth is more muted. So it looks pretty hard on paper to hold prices below $80 Brent for a longer period of time. On the other hand, if we assume that shales can produce what they have recently, then prices above $90 Brent are again starting looking dicey. At this level, not only are shales more incentivized, but conventional is also more viable, and demand growth should be more muted. Therefore, I would put longer-run system-wide marginal cost in the $85 Brent range.
I disagree with JPM and some of the consultancies that prices can be kept below marginal cost for as long as two years. I believe 12 months is about the limit. Therefore, if you think I think mid-year 2016 Brent futures are compelling at $63.30, you are right. I would caution, however, that we may still have a big overhang coming in Q2, so any investment of this sort should have sufficient downside protection.
The thing is nobody knows what that long-run marginal cost of production will be, and transportation costs and demand and regulation (eg limits on US crude exports) all matter. The 2020 futures contract price is no guide. We do need to think about what happens when the major US tight oil fields deplete, but the estimates that had that coming already around 2020 look very pessimistic now.
James your posts on oil are must a read for me, thank you.
When horizontal drilling/hydraulic fracturing boom hit natural gas, a lot of executives were saying at drilling was uneconomic when gas was below $4.50 but it’s been seven years now.
We have seen some substantial regional declines in predominantly dry gas areas, like the Haynesville Shale Play, and to a lesser extent, in the Barnett Shale Play. The Haynesville Play is an interesting case history. EIA data show that Louisiana’s shale gas production increased from 1.1 BCF/day in 2009 to 5.8 BCF/day in 2012. At this rate of increase, Louisiana’s shale gas production would have been up to about 31 BCF/day in 2015.
However, primarily due to a decline in Haynesville Play drilling, Lousiana’s marketed gas production (from all sources) fell by 20% from 2012 to 2013 and by another 17% from 2013 to 2014. Note that these were net declines in production, after new wells were put on line. The gross declines, from existing wells in 2012 and from existing wells in 2013 would be even higher.
Louisiana gas data:
http://www.eia.gov/dnav/ng/ng_prod_sum_dcu_sla_a.htm
The Louisiana data provide some support for a Citi Research estimate that the underlying gross decline rate for US gas production is on the order of 24%/year. In round numbers, this decline rate estimate implies that in order to maintain current US gas production, we have to put on line the productive equivalent of current Marceullus gas production–every single year, just to maintain current gas production.
The Haynesville Play is interesting for another reason, since it shows the lag time between a decline in drilling and a decline in production in this play:
http://i1095.photobucket.com/albums/i475/westexas/Haynesville-rig-count-and-natural-gas-production1_zpsb1n95tiz.jpg
Ok, so using this Econbrowser calculator, I get about $2.75 at the pump at $75-$80/barrel:
https://econbrowser.com/archives/2014/06/gasoline-price-calculator
Can you tell me if the following is a reasonable approximation of this new reality? Due to the near limitless supply of shale that can be pumped profitability at around $75-$80/barrel, it represents a ceiling for future US gas prices of about $2.75, no matter what the Saudis, Opec, Russia, Venezuela, Nigeria etc. do.
Crude breaks to a new low today. Once time had transpired and crude showed it could not break out of the 3-day range set immediately off the January bottom, that failure meant resolution would eventually be to the downside. This has now happened. The market will now establish a new range. And all markets will reset off this. Crude oil prices>energy pass-through>core inflation>overall inflation>eventual bottom in inflation as perceived by the Fed>fed funds rate>rest of yield curve. This resetting will be a multi-month process. The element of time needed for processes to play out in an economic system means an inflation bottom cannot now be perceived (confirmed) before the June FOMC meeting. The only way the Fed could hike in June without seeing the higher back-to-back PCE numbers needed to confirm a bottom is by abrogating on the inflation prong of their mandate. The market would punish that.
In the first link, the author states the gap between production and consumption has shrunk to the lowest level since last April. The data show otherwise. An error of this nature puts his entire argument in jeopardy. The care taken in writing a piece reflects on the author’s mind and gives us information.
The globe hardly needs more inventory this calendar year. Hence, if production is above consumption then pressure on price will continue to be downward. The salient chart is EIA 2015 World Liquids Production and Consumption Forecast. If inventories were already in excess, and if production is greater than consumption, as is the case each month on the chart, why would price rise? Unless I am missing something, inventory increases (flows) each month drive the level of inventories to greater and greater excess, but for the insignificant increment needed for trend-inventory-growth. Hence the first author’s main argument doesn’t hold water.
This takes us to the Kopits’ article. It is much more nuanced. Which makes any useful forecast more difficult to ferret out. Nonetheless, the thinking is quite useful as it gives us insight into various aspects that may otherwise remain hidden. Kopits’ main thrust harkens back to the 1986 episode as a parallel to today. At that time, Kopits says, both production and consumption responded quickly to the huge drop in price. Not to split hairs, but I recently (Dec 22nd) looked at this episode and concluded an 8-month lag time. That seems longer than the Kopits article expects. Be that as it may, something else is vitally important. The world is quite different – different in two ways.
Today a new supply force is in the picture. For the horizon of its short life, US fracking and increasingly non-US fracking must now be reckoned with. With no blame here, estimates of the average global marginal cost are all over the place. But when all is said and done, the dynamically changing technology of fracking and its global spread will keep downward pressure on price. Equally important, the demand situation is different today. Hamilton estimated 45% of the drop in price last fall was due to global demand. In 1986, demand was stagnating because of high price. The price decline in 1986 was wholly due to tapering demand growth. The Saudi’s finally had to relent and increase supply, otherwise Saudi revenue would have fallen to zero. But the prime initiating cause back then was dwindling demand in a market where price was being held artificially high by a cartel.
Today’s episode has a different source on the demand side. That of stagnating global economic demand because the Chinese economy is (this is too harsh a word) imploding. The global locomotive has derailed. Oil demand is suffering from the deceleration of global growth that’s radiated out from China. This is quite unlike 1986. So, things are going to play out differently as well. The deflationary pressures from China’s inevitable and now-arrived slowdown press down on all prices everywhere. This is not going to go away overnight. At the same time, fracking presses down on price from the supply side. This is a one-two punch. Forget the monthly numbers. This is the big picture. It is layered over the very large template of conventional oil well depletion which works the other way on price. Nonetheless, this one-two punch is the marginal mover and promises to keep oil prices down for a very long time. Surely through 2016. As at a higher level of causation, the globe has entered a box canyon with walls of too much debt from which there is no escape. That debt grew since the 2008 crisis nowhere faster than in China. The unintended consequences have just now begun to reveal themselves.
JBH –
I continue to believe that 1986 is the correct template. The data are supportive. For example, here’s a piece from John Kemp.
http://bakken.com/news/id/234911/u-s-fuel-consumption-is-soaring-amid-cheaper-prices-kemp-2/
The quarterly data from 1986 show that Q2 was the big quarter, with OECD demand rising by nearly 5% in this quarter alone. I think we’ll see something like that again. Obviously, 5% growth is not needed to rebalance the market. 1.2% growth would do it nicely. So we’re not talking about a huge gap.
I don’t know how you keep oil prices low once the market has rebalanced. You need at least sufficient price signals to turn around the NA rig count. We can debate the number. Pioneer, for example, seems happy at $70-80 WTI. Some claim lower prices. I personally don’t think $70 WTI will stop the rot in onshore conventional and at the IOCs. At that price, shales will both have to grow rapidly to meet new demand, as well as displace existing supply. It’s quite a challenge.
And then we have Whiting, a leading Bakken producer, which put itself up for auction in the middle of the biggest price downturn likely for a decade. Why would someone do that? If shale is effectively the entire source of incremental supply globally, then prices must be high enough to reward shale oil producers for dynamic production growth over the next twelve months. Why wouldn’t the company seek to refinance debt or make a modest capital increase to provide interim liquidity? Why would management head for the doors? Makes you wonder about the underlying economics.
Stephen:
1986 is the only template. So it attracts like a flame to moth. Yet the macro context is very different. Then there was a big three: Europe, US, Japan. Today there is a big four. China, the locomotive of this tepid recovery, is now derailed. You can get off on the wrong foot by not fully recognizing this. China was the straw that broke the oil camel’s back. Nor is China’s slowing transitory.
In ‘86, central banks had begun forcefully taking the dollar down. Though for different reasons, the direction is quite the opposite today. The US economy had a swift undercurrent coming off the ’82 bottom. Because that recession was a true, healthy cleansing, the economy was poised for a long run ahead. Japan was a powerhouse. All these conditions (and more) are reversed today. Always dicey picking comparison starting points. That said, let me take the two oil peaks and look two years ahead. Sep ‘85 WTI at $30.81, fell to $11.59 by Jul 1986 and by Sep ’87 had rebounded to $19.53. June 2014, oil at $105.79. We don’t yet know the bottom. If it’s not until a 62.4% drop as in ’86, oil will go to $39.80. A proportionate rebound would then take it back to $67 in Jun 2016. The market is itching to take oil to $39. The market has a very long memory, and coincidentally $39 was the 2009 low. Within this 2-year horizon, the sharper the drop the bigger the rebound. If oil stops today at $42, it’s less likely to get to $67. Momentum must never be denied.
Suppose it goes to $39 (which I judge is where it is going, if not further), now we can look at the comparisons. Year-over-year, world real GDP grew 3.4% in ’86. The US 3.5%, EU 2.9%, Japan 2.8%. There was a hit to growth in ’86 of ½ ppt. Then an equivalent rebound in ’87. The oil dislocation was temporarily stunning.
Even more critical differences. The funds rate fell from 7.9% to 5.9% the first year, and averaged 6.6% in the second. The 10-year fell from 10.4% to 7.5%, and averaged 8% in the second. Today the funds rate is going up, and just maybe the 10-year will average 20 basis points lower in year two than where it was last June. The consensus actually expects it to average higher. US monetary policy is a headwind for global growth, and hence oil. Economic fundamentals were strong in ’86 thanks to the recessionary cleanse of ’82, and sensible policy including deregulation. The expansion was 3-years young when oil prices started collapsing, and the expansion ran 4 more years. Hence the bull market in stocks was real. The expansion was 5 years along this time when oil dropped. And today the stock market is at the cusp of being the 3rd largest bubble ever! World oil consumption rose 2.9% ’86 over ’85; US rose 3.5%. That in the context of tailwinds from monetary policy, the energy-intensive US economy benefiting from a falling dollar, and Japan ramping up to 4% growth in ’87 and 7% in ’88. Today there are only headwinds, and they are severe. Add to that the fracking boom on the supply side, no matter that it is being muzzled. (Depletion of conventional oil cuts the other way, of course.)
The biggest headwind is debt! In the ’86 episode, debt was not far from optimal. This cushion allowed US credit to increase 14% in ’86 and 10% in ’87. Hence aggregate demand got a big boost, and hence so did oil demand. Today global debt is at an historic high. Far, far beyond optimal. Precisely why China is slowing, the eurozone is at stall speed, and Japan is and will not get anywhere. Nothing but stagnation until the debt ratio comes down. For comparison, US credit rose 1.9% last year and is on track for 2% this year. That’s below nominal growth, precisely the opposite of the 1986:Q2 surge you refer to. On top of all this, financial fragility has to be reckoned in. Over the remaining course of the 2-year horizon, there is a non-zero probability the next – for there will be one – financial calamity may strike. This has to be factored into the oil analysis.
Global growth is a function of the dollar and global trade, exchange rate problems emerging markets are now having, wrenching change in the oil patch, monetary tightening in the US, QEs abroad that may have some minor positive effect during our horizon, asset markets across the globe in bubbles, and a level of debt that is highly constricting. These larger forces make vehicle mileage etc. minor players. Arguing from Texas as Kemp does is a classic mistake. It is narrow and monotonic. Not only that, the current Feb-over-Feb change he touts as his main argument is not much bigger percentage-wise than the prior one. The marginal impact on Texas motor fuel tax receipts of the drop in oil has hardly been a big one. And “as the economy strengthens” is contrary to what is happening. The flow of economic reports since September is showing the largest cumulative net negative since 2010. Q1 growth will be dismal. Nor do we know when this will turn up, as we have never been in a place like this before. Specifically, in (a) an artificial economy post-crisis with (b) China now decelerating. Though not well understood, the second derivative is always a dominant force. All this means $67 oil by June 2016 is unlikely.
So Far, Saudi and Global Net Exports of Oil Peaked in 2005
A crucial point about Saudi Arabia that almost everyone overlooks is that Saudi net oil exports have been below their 2005 net export rate of 9.1 mbpd (total petroleum liquids + other liquids) for eight, almost certainly nine, straight years.
As annual Brent crude oil prices rose from $25 in 2002 to $55 in 2005, Saudi net exports increased from 7.1 mbpd in 2002 to 9.1 mbpd in 2005.
As annual Brent crude oil prices averaged $110 for 2011 to 2013, Saudi net exports averaged 8.7 mpbd for 2011 to 2013 inclusive, versus 9.1 mbpd n 2005.
While it’s possible that the Saudis chose to reduce their net exports after 2005, a more plausible scenario in my opinion is that they could not exceed their 2005 net export rate, at least without doing long term damaged to their reservoirs.
Global Tight/Shale Plays to the Rescue?
Regarding tight/shale play potential globally, a key question is whether wells like the Bakken Play, i.e., quickly declining wells with an average production rate of a little over 100 bpd and a median production rate of less than 100 bpd, will work in much higher operating cost areas around the world.
Also, one has to consider the quality of the liquids production from tight/shale plays.
What refiners want and need is generally 40 API gravity and lower crude oil (and when we ask for the price of oil, we get the price of 40 API and lower crude oil). The EIA’s own data and projection show that it took about half the global (oil and gas) rig fleet to increase US 40 and lower API gravity crude oil production by just 0.5 mbpd from 2011 to 2014.
EIA chart showing actual and projected US liquids production by API gravity (light blue and lower on the chart is 40 API and lower):
http://i1095.photobucket.com/albums/i475/westexas/US%20Crude%20Oil%20Production%20by%20Type_zpsso7lpqgq.png
Grades of Global Crude Oils:
http://i1095.photobucket.com/albums/i475/westexas/APGravityVsSulfurContentforCrudeOils_zpsc28e149c.gif
Refinery Yields by API gravity (note tremendous decline in distillate yield over 39 API):
http://i1095.photobucket.com/albums/i475/westexas/Refineryyields_zps4ad928eb.png
Jeffrey,
Any thoughts about Tuesday’s WSJ article discussing Iranian oil production?
On the upside, there are two wildcards today, that is, Iran and Libya.
A deal with Iran could bring an additional 1 mbpd onto the market, substantially depressing prices for as much as six months, I would guess. But timing and certainty are hard to predict.
Big demand numbers coming out of India and Europe, by the way.
Steven,
Thanks for the comments! I wonder when XOM and CVX may be worth buying?
AS,
FYI, I meant to post my comment down the way, as a reply.
California (Bay Area) is still $3.25/gallon at the pump. California gets mostly Brent prices, not WTI, but still. Cheap oil has not made gas prices much lower in the Bay Area.
That isn’t about crude price:
http://www.sfchronicle.com/business/article/End-of-refinery-labor-strike-could-mean-cheaper-6133179.php
As Steven noted, many things are possible, but it’s worthwhile reviewing some previous scenarios regarding Brazil & Iraq.
Circa 2009, the Iraqi Oil Ministry claimed that Iraq could hit 12 mbpd of production within about seven years, and following is a graph prepared by Stuart Staniford, showing a simple extrapolation that would put Iraq’s oil production at 12 mbpd by 2016. In 2014, based on the projection, they would be at about 9.6 mbpd.
Iraq’s actual production in 2014 was probably about 3.3 mbpd (total petroleum liquids).
http://3.bp.blogspot.com/_D9-JNTtRKgs/S0AwzBBUVqI/AAAAAAAAAMg/I9C6ykZfByY/s1600-h/Picture%20117.png
And following is an April, 2009 Bloomberg column talking about Brazil’s projected rising oil production “Taking market share away from OPEC.” In reality, Brazil is a net oil importer, with a recent track record of increasing net imports, even if we count biofuels as production. In 2009, Brazil’s production was basically equal to production, but by 2013 their net imports had increased to 0.4 mbpd.
Iraq’s net exports increased from 1.8 mbpd in 2009 to 2.3 mbpd in 2013 (total petroleum liquids + other liquids, EIA). So, the combined increase in net exports from Brazil + Iraq from 2009 to 2013 pretty much rounds to zero (0.1 mbpd).
Also, in regard to the April, 2009 Bloomberg column and the following quote from said column, “As OPEC nations make their biggest oil production cuts on record, Brazil, Russia and the U.S. are pumping more, threatening to send crude back below $50 a barrel as demand slows,” monthly Brent crude oil prices were then in the process of rising at 43%/year, from December, 2008 to February, 2011.
April, 2009: OPEC Cuts Thwarted as Brazil, Russia Grab U.S. Market
http://www.bloomberg.com/apps/news?pid=newsarchive&sid=aiSCDyK4CWmI&refer=news