Currency appreciation will be a drag; this implies a policy of slower monetary tightening is in order
The Dollar’s Rise In Context
The dollar has risen by over 20% (log terms) against major currencies since July, as of 3/13. Against the euro, the dollar has appreciated by over 25%.
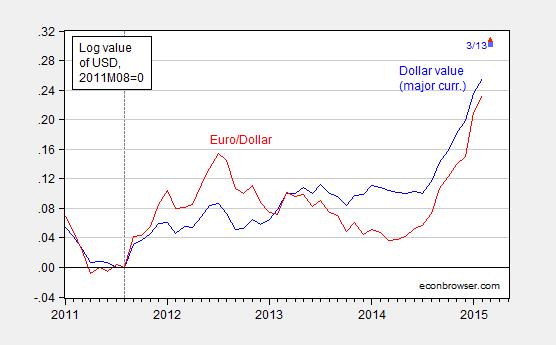
Figure 1: Log value of US dollar against basket of major currencies (blue), and against euro (red), normalized to August 2011. Values for March pertain to 3/13. Source: Federal Reserve Board via FRED, and author’s calculations.
The angst concerning the dollar, in particular the drag induced by expenditure switching (reduced exports, increased imports), is reflected in many accounts, including U.S. economy’s surprise risk: The dollar’s surge could weaken growth:
The surging value of the U.S. dollar promises new bargains for American consumers and travelers but also presents big threats to the U.S. economy — in a trend that is shaping up to be one of the most unexpected and significant factors driving the global economy this year.
…
The unexpected surge has led economists to reduce their expectations for U.S. economic growth this spring; this week, it pushed markets into negative territory for the year. It’s happening largely because the U.S. economy has been unusually strong amid a global slowdown, giving the dollar an advantage over other currencies.
I would take issue with the assertion that the induced drag was a surprise. Analysts had worried about the appreciating dollar back last year, when the surge was already apparent.
The article makes clear that it’s the real value of the dollar that’s relevant. Figure 2 presents a longer view on the dollar’s real value.
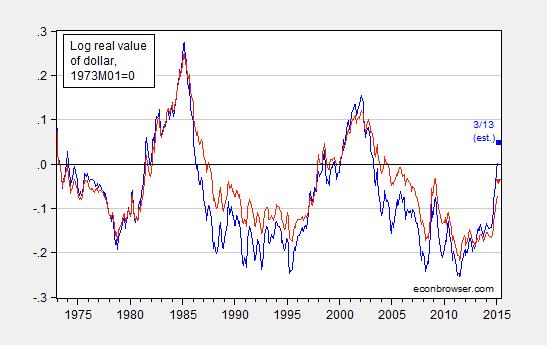
Figure 2: Log real value (CPI deflated) of US dollar against basket of major currencies (blue), and against broad basket (red), normalized to March 1973. Values for March pertain to 3/13, and assume that the real appreciation from February to March equals that for nominal (i.e., inflation differentials are zero). Source: Federal Reserve Board via FRED, and author’s calculations.
Note that the broader index is probably more relevant, given the importance US trade with China (which is not in the major index).
Figure 2 makes two points clear. First, the appreciation over the past six months is very rapid. Second, the appreciation is not unprecedented; however, the last such episode – during the post-Lehman flight to safety – was short-lived. Before that, it was in the wake of the East Asian crises. That episode augurs ill to the extent it presaged a long period of widening trade deficits (although with rapid growth).
Implications for Trade Flows and Growth
The US trade deficit has shrunk considerably since its peak of 5.9% of GDP in 2005Q4. It was 3.1% of GDP as of 2014Q4 (second release). The non-oil trade deficit has exhibited a much smaller decrease; the 3.8% deficit has shrunk to 2.1% as of last quarter. Notice that the real value of the dollar, lagged two years, has an inverse relationship with the trade balance. Hence, eventually, it makes sense that the deficit will eventually deteriorate (relative to counterfactual) as a consequence of the recent appreciation.
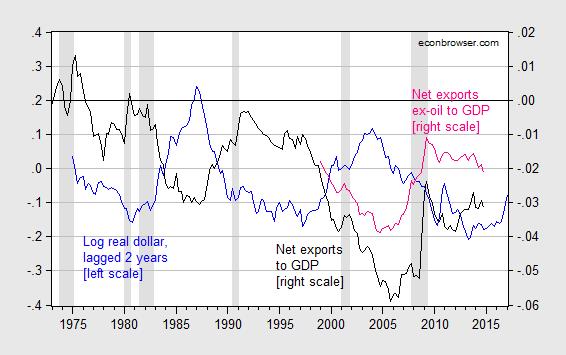
Figure 3: Log real (CPI deflated) value of US dollar against broad basket of major currencies, 1973M03=0 (blue, left scale), net exports as share of GDP (black, right scale), and net exports ex.-oil (pink, right scale). Note 2015Q1 value of the dollar based on January and February data. NBER defined recession dates shaded gray. Source: Federal Reserve Board via FRED, BEA NIPA (2014Q4 second release) and trade releases, and author’s calculations.
The recent deterioration in the ex-oil trade balance indicates that the dollar isn’t the only determinant. (And, in fact, a better measure of competitiveness would be a productivity adjusted real value of the dollar; such a series is not available for a basket of currencies that includes the yuan. For more, see this paper).
Obviously, domestic economic activity (for instance partly indicated by the recession dates) is important to changes in the trade balance. Foreign economic activity is as well, although that factor is not shown in the graph.
While Figure 3 is suggestive, we would want to know more than the impact on the trade balance to GDP ratio (keeping in mind exports, imports and GDP all respond to the real exchange rate). This leads to the next section.
A Static, Partial Equilibrium, Back of the Envelope Estimate
As in previous instances, I rely on statistical models of trade flows, taking into account at a superficial level vertical specialization and heterogeneity. Imports depend on domestic GDP and the real value of the currency; exports depend on foreign economic activity and the real value of the currency. Since oil imports and agricultural exports are primarily denominated in dollars, I omit these flows from the calculations.
In this paper, I find the long run (in a statistical sense) elasticity of nonagricultural exports of goods with respect to the real exchange rate is 0.690 (Table 2), and nonpetroleum imports of goods elasticity is 0.446 (Table 3). These estimates are obtained using dynamic OLS (DOLS), following Stock and Watson (1993). Assuming the 20% appreciation is sustained, then exports are about 13.8% lower than they otherwise would be, and imports about 8.9% higher.
Given that nonagricultural exports are 1349 billion Chained 2009$ (SAAR), and nonpetroleum imports are 1976 billion Chained 2009$ in 2014Q4, then such changes would be equivalent to 174 and 184 bn Ch.09$ at annual rates. This implies about a 2% decrease in the level of real GDP, relative to what it otherwise would be (assuming a multiplier of unity). Obviously, the impact of the 20% appreciation would take some time to affect flows, so the impact on GDP growth would be relatively small per quarter.
Goldman Sachs, in a March 9th note [not online], argues that the drag arising from dollar appreciation should be about one-half percentage point of growth over the next two to three years. That is equivalent to something slightly smaller than the 2 percentage point lower level of GDP relative to baseline.
What Is to Be Done?
There are many caveats to the above static, partial equilibrium, analysis. Scott Sumner for instance argues that one should be careful about partial equilibrium analysis. While this is wise advice in general, in my view is there is, from a statistical standpoint, a very large exogenous component to exchange rate movements (that’s partly why exchange rates are so hard to predict). Expectations of euro monetary easing or (following Krugman) persistent slow growth in the euro area, are largely out of the control of American policymakers, and only minimally affected by US growth rates.
So, I would say the logical conclusion is that policymakers should put a higher weight than they have heretofore on foreign developments, and in particular, the value of the dollar. One way they can weaken the dollar relative to the counterfactual (I know many readers don’t believe in such things, but this is the right way to think about it) is, given the policy rate is essentially at zero, to maintain an accommodative stance in terms of forward guidance.
As I noted in this post, the correlation between the euro-dollar exchange rate and the US-euro area shadow policy rate differential is pretty apparent. Here is an updated version of the earlier graphs.
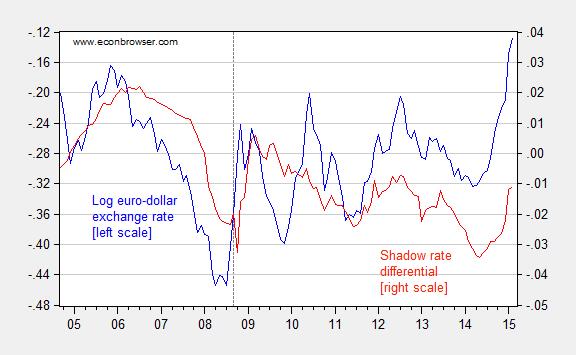
Figure 4: Log euro-dollar exchange rate (blue, left scale), up is dollar appreciation; and US-euro area shadow policy rate differential (red, right scale). Source: Federal Reserve Board via FRED, and Wu and Xia, and author’s calculations.
Delaying the lift-off would serve to maintain growth, with no appreciable risk of inflation.
Menzie wrote:
Currency appreciation will be a drag; this implies a policy of slower monetary tightening is in order
Menzie,
Don’t faint! I totally agree with your sentence above and almost everything you wrote in this post. I have to admit that I totally misjudged Janet Yellen. From her rhetorice before taking the reins at the FED I expect her to enter another disastrous increase in the money supply. Instead she significantly stabilized the dollar. But now the price of gold – the best monetary indicator, but more on that in another post – has declined to almost its 10-year average price.
Current conditions are very much reflecting the conditions at the end of the 1990s. Greenspan managed a very stable dollar at the beginning of his reign. In 1994-5 the dollar was at $384/oz of gold for two years. That is remarkable and unprecedented stability compared to any period following Nixon blowing up Breton Woods and floating the dollar. But in 1996 Greenspan began to use the “Greenspan” standard and gold fell from a high above $410 to below $370. Then in 1997 it fell below $270. By 1999 it had fallen to below $253 lower than it has been for 20 years.
The price of oil at the time fell significantly to $10/bbl which was right at or below the cost of production.
By the end of 2000 we were in a recognized recession, though it actually started in April of 2000.
The decline in gold and oil today is about as much as that in the late 1990s. Unless there is a change in direction – monetary expansion – we could see a repeat of the 2000 recession. But the difference is that in 2000 we were coming off of almost 20 years of expansion. Today we have been in almost 10 years of economic decline.
The 2000 recession was short-lived because of the 2003 Bush (Rep. Bill Thomas) supply theory tax cuts. The election in 2016 is critical. If another Keynesian president is elected we could see economic disaster greater than the Great Depression.
ricardo,
“The 2000 recession was short-lived because of the 2003 Bush (Rep. Bill Thomas) supply theory tax cuts.”
actually it was short lived not due to supply theory tax cuts, but due to deficit spending. you completely misunderstand what happened in the 2000’s.
Menzie’s post is instructive in our discussion of the accuracy of government (and other statistical) data.
There are two glaring examples. First is the fact that the RMB of China is not in the statistics. Menzie does mention that and adjusted index including the RMB would be more relevant, but that simply admits the weakness. A basket of currencies is only as good as the currencies in the basket and as importantly the weight of each currency. This is totally arbitrary based on the best guess of some board or maybe even one person.
Secondly, Menzie says it best, “Since oil imports and agricultural exports are primarily denominated in dollars, I omit these flows from the calculations.” Eliminating one of the most significant commodities from calculations does not make the calculation better, it simply highlights how weak the data for the calculation is.
For estimates of where we are or general indicators of economic trends such calculations can be interesting, but the problem is that in a command economy like that in the US the errors can cause huge economic dislocations leading to economic decline.
Once again the market is proven to be the best at allocating factors for production and establishing trade and pricing policy. Command decisions simply compound error we know are baked into the statistics.
Ricardo
As for the RMB. China is an important trading partner, to the US and to the World. But its monetary policy is determined by the US. Because of the China fix, RMB to the Dollar, any graph of the RMB value to the rest of the world currencies, basket or individual, is the same as the dollar.
Ed
Ed,
That is true but to me that seems to make it more important to be included in the statistic. It would moderate the reported volatility of the dollar to the basket of currencies. For example if the only currency was the yen the dollar would be appreciating significantly. Add the Euro and you still have a huge appreciation. But add the yuan and the basket is averaged down.
If China used the dollar I would agree with you but they do not so the dollar has to be exchanged for the yuan to transact business in China.
Ricardo: You really should read more closely. The RMB is not in the “major currencies” basket but is in the “broad” basket. Hence, in Figures 2 and 3, the RMB is is included.
Would it kill you to consult some actual data, maybe even use the spreadsheet to do your calculations (I know from your previous comments you are unable to do them manually, especially when it comes to percentages). Agricultural exports in 2014Q4 accounted for 6.4% of total exports. Petroleum imports accounted for only 10.8% of total imports. Those are “significant”. In any case, omission of these categories from the calculation doesn’t matter unless you think the dollar’s value is of first-order importance to the quantities. To the extent these flows are relatively small relative to aggregate exports and imports, your point is irrelevant.
Menzie,
I thought that was what I said. It depends on which number you use whether the RMB is included. I even mentioned that you made this point. Oh well…
Only an economist could consider bad data irrelevant to policy decisions.
Ricardo: But that’s exactly why I focus on the broad index, and yet all you talk about is “bad statistics” impairing the analysis. Perhaps I don’t understand your logic.
My point in showing the major index is to highlight there are several exchange rates; and in fact for some issues, the major index might be more relevant. For instance, if I were considering interest rate differentials, and how much movement in expected exchange rates would validate UIP, the major index would be more relevant than the broad.
Menzie,
I understand that and it has value as a novelty, but it is disastrous when used to make policy. When there is more than one index that is considered valid which do you choose? It depends on your whim. And at the national level that whim drives everything else even if 90% of the people disagree.
This is my problem with econometrics. Econometrics is fine if you understand how it is useful (Schumpeter) but it is disastrous if it is used wrong. The problem with government econometrics is that government economists see it as a hammer and the economy is a nail. The problem is that the economy isn’t a nail, it is a social system.
Ricardo: You write “When there is more than one index that is considered valid which do you choose?” This is one of the craziest (but not the craziest) thing you have written. Suppose I want to measure the rate of change of prices faced by consumers. I would use the CPI. Suppose I want to measure the rate of change of prices charged by producers to wholesalers. I would use a PPI. Suppose I want to measure the rate of change of import prices. I would use the import price deflator. I would not use the CPI to measure the prices of imported goods. But all are equally valid indices — for some purpose.
By the way, this is not an issue of econometrics. It’s an issue of price index theory.
The goal should be to improve U.S. living standards more quickly in this weak recovery and liquidity trap. So, we need tax cuts and deregulation, for consumers and producers, to raise U.S. GDP growth and become a more powerful engine to pull the rest of the world’s economies.
No, you need – 1. an increase in the minimum income tax deduction credit so that the people most likely to spend a tax cut are the ones that will get it. 2. a large infrastructure program to provide higher paying jobs for American workers 3.. a lobbying effort to get Europe and Asia to commit to their own infrastructure programs 4. QE 4
David, so, you want to give more tax credits, adding to the massive fraud, only to low income workers and not to the struggling tax-paying middle class.
And, there’s nothing wrong with some saving, e.g. to pay-down debt, for retirement, a down payment on a house etc.. A $5,000 tax cut per worker is a regressive tax cut. Why reward only low skilled or part-time workers?
Moreover, why only provide high-paying infrastructure jobs to relatively few workers? Will creating public goods do much to clear the market of, or raise demand for, private goods?
We wouldn’t need QE4 if work and entrepreneurship were rewarded through lower taxes and less regulation rather than even steeper progressive taxes and even more burdensome regulations.
Well, the next year will be interesting. About a year ago QE full throttle , combines with austerity in Europe,
lead to a euro at compared with today’s 1.05. At 1.4 European recovery ground to a halt.
Now with the US raising rates , European interest rates below zero, ECB flogging full QE,
the roles are reversed. The US recovery grinds to a …… Please fill in the blank .
My biggest disappointment since 2007, is the lack of fundamental reform,
and international policies working at cross puposes between the US, Japan, and Europe.
John,
The FED began to end its monetary expansion at the end of 2011 not only 1 year ago. The dollar has been appreciating for more than 3 years. Many currencies that were actually stable appeared to be depreciating because the dollar was appreciating. Almost every currency has lost value relative to the US dollar, but that is as much, often more of, a factor of the appreciation of the dollar. This can be seen dramatically if you look at a graph of the US dollar v the Australian dollar and/or the Canadian dollar. Both were slightly stronger than the dollar at the end of 2011. Today they appear to have had a dramatic decline. Actually they have been stable but the dollar has fluctuated. You see just the opposite trend before 2011. Our FED has been nearly incompetent at keeping the dollar stable especially since 2000 even though monetary stability was one of the primary reasons it was created.
“One way they can weaken the dollar relative to the counterfactual”
Do you really think this is a good idea? With euro instability, aren’t you afraid that tryiing to beggar-ourneighbors with short-term gains from a weak currency could prove counterproductive?
don: Competitive devaluations are not beggar thy neighbor, when the price level is too low.