The New York Times has an article in The Upshot today, which shows the yield curve over time in a nifty map. They also show the topography for yields in Germany and Japan.
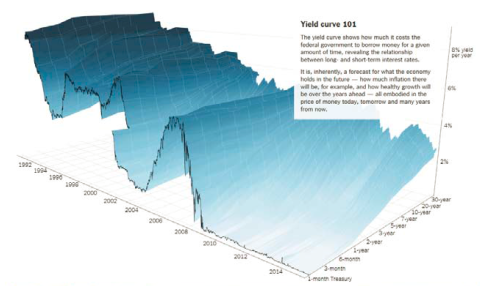
One conclusion they come to for the US: “The yield curve is fairly flat, which is a sign that investors expect mediocre growth in the years ahead.”
This conclusion is in line with recent work with in Chinn and Kucko (March 2015). We conclude:
This paper has explored the importance of the yield spread in forecasting future growth and recession. Generally speaking, when using the entire data series from 1970-2013, in-sample results suggest the yield spread is indeed important and has significant predictive power over a one-year time horizon. The results deteriorate when forecasting growth two years ahead. Moreover, it appears that the forecasting power is weaker during the great moderation up until the financial crisis of 2008. However, each of the six European country models exhibited relatively high R-squared statistics (above 0.1) when using data from 1998-2013. While the explanatory power is somewhat less for certain models estimated over the early subsample, the data still suggest the yield curve possesses some forecasting power for European countries.
…
In summary, we do not obtain a simple story for the yield curve’s predictive power. The yield curve clearly possesses some forecasting power. However, there is also some evidence the United States is something of an outlier, in terms of its usefulness for this purpose. And overall, the predictive power of the yield curve seems to have rebounded in the lead up to the Great Recession, reversing a longer term trend of declining predictive power.
Here’s the term spread for the 10 yr-3 mo and 10 yr-2 yr Treasurys.
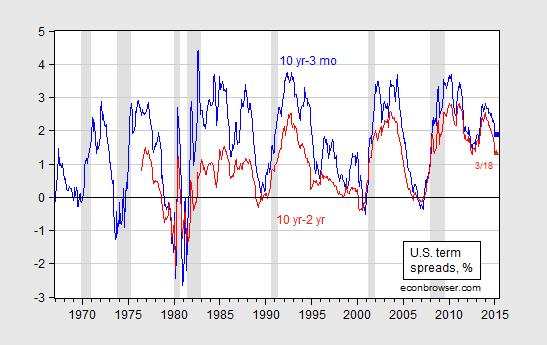
Figure 1: Ten year-three month Treasury spread (blue) and ten year-two year Treasury spread (red), in %. Observation for March pertains to 3/18. NBER defined recession dates shaded gray. Source: Federal Reserve Board via FRED, NBER and author’s calculations.
Using the February observations, and an updated regression extending from 1970M01-2015M02, the implied probability of a recession in the next six months is 8.4% (using the 10 yr-3 mo spread).
More on the subject, here.
One issue, Menzie. Set me straight if I’m wrong, but One statement made by the article, however, is flat out wrong: “The yield curve is fairly flat, which is a sign that investors expect mediocre growth in the years ahead.”
Not so. The link below will take you to a graph of the spread between 10 year and six month bonds, currently at 2%. The graph then subtracts 2 so that the current spread = 0.
http://research.stlouisfed.org/fred2/graph/?g=14K7
The spread is not fairly flat, but is steeper than most other times during the last 30 years. It is also steeper than at almost all times between 1933 and 1954, when the US saw the strongest growth in its entire history.
New Deal democrat: Well, “fairly” is a pretty loose word. I agree, the curve steepness as measured by 10yr-3mo and 10yr-2yr spreads, is not particularly high.
Professor, while I agree re the 10 year vs. 3 month spread, the 10 month vs. 2 year spread is actually steeper than at most times over the last 30 years.
Also, the yield curve never inverted from 1930 – 1954 with one brief exception before 1950. I gather the data behind your calculation of the odds of recession does not go back to that period. If we are in a deflationary-type period similar to that period, I’m not sure your regression works. Since we do have some data going back that far, have you considered extending your analysis back that far?
Menzie,
I used to be a yield curve junkie but then I found out it depended on WHY the curve flattened alah Volker
If it did because of rates rising then recession here we come. However if it occurred because of bond yields falling not so fast.
nottrampis: Yes, that’s why sometimes the short rate is included, as we do in the paper. That specification implies a 5.6% probability.
Menzie,
I used to be a yield curve junkie however surely it depends on WHY the curve has fattened.
It the Central Bank raises short term rates alah Volker in the 80s then yes you get a recession. However if the curve flattens because bond yields fall then it is another story
it’s a neat graphic, but i really would like to see that go back to the 50s, cause i have a sense that’s most like the recent years…a visualization could confirm that, without the legwork it would take me to do it myself…
The yield curve did not invert from 1931 to 1954 in the US, and there has been no inversion prior to recessions and bear markets in Japan since 1992.
Similarly, during the debt-deflationary Long Wave Troughs of the 1890s and 1830s-40s (as we are in today since 2008), neither did the best proxies for the yield curve invert.
There will be no yield curve inversion as a precursor to a recession in the US for many years to come.
Therefore, any model that relies upon the yield curve spread (or on money supply that does not adjust for the surge in bank cash assets/reserves) to anticipate/forecast a recession will be rendered less useful, if not irrelevant.
You might want to try doing the same analysis with quality spreads– for example between T bonds and BAA bonds.
You will find that quality spreads are also a good leading indicator. They tend to move with capacity utilization.
I tend to agree with Barry Ritholtz that part of the reason rates remain low is the lack of supply of quality debt issuance. http://www.bloombergview.com/articles/2015-03-19/the-bonds-than-might-help-cure-what-ails-america
I think if the US were to refinance its debt into long-term (50 year bonds) and use a portion to finance infrastructure we could really boost the economy (and see a steepening of the yield curve).
I’ve often wondered why they don’t do this? Seems so short-sighted to me.
Who would invest in 50 year bonds?
Borrowing more from the future, which means we have to pay more in the future, is a good idea if it’s worth the higher growth in the present.
Unfortunately, we borrowed over $5 trillion for an L-shaped economic recovery in recent years.
It would’ve been much cheaper to reduce and remove anti-growth policies, at least temporarily, until the economy recovered, rather than raised and added more of them.
peak, exactly how would you have stopped the crash and at least produced an L-shaped recovery without increases in welfare and unemployment benefits during the financial crisis and aftermath? at the time anti-growth policies had nothing to do with the collapse of the economy-lack of demand was your biggest problem. you seem to be providing a solution to a problem that did not exist-or at least was not a dominant problem. your ideology of “pro-growth” policies simply does not work in a falling demand environment. wrong way to look at the problem.
Baffling, Congress could’ve prevented the financial crisis by gradually raising lending standards for home buyers in 2004, when the tightening cycle began, to reduce the moral hazard in private lending, e.g. requiring a down payment, proof of income, proof of employment, etc..
Also, since Americans were buying foreign goods and foreigners were buying U.S. Treasury bonds, while annual trade deficits rose to 6 percent of GDP by the mid-2000s, huge tax cuts were needed to allow the spending to go on.
Piling on more regulations and more disincentives to work are anti-growth policies. Moreover, the small and slow tax cuts failed to jolt the economy into a self-sustaining cycle of consumption-employment.
I’ve explained it to you before. We needed at least a $5,000 per worker tax cut, an increase in unemployment benefits, rather than endless extensions, overhauling the $2 trillion a year in federal regulations, rather than just adding more regulations, which the economy has been unable to absorb, and tax reform, along with a higher minimum wage, that promotes work and investment.
peak
“Congress could’ve prevented the financial crisis by gradually raising lending standards for home buyers in 2004, when the tightening cycle began, to reduce the moral hazard in private lending, e.g. requiring a down payment, proof of income, proof of employment,…”
seriously, congress should be telling the private sector how to operate and control risks? and they could have done this before a fiscal crisis occurred? i am sure political hacks such as kudlow would have simply let this occur without comment. remember him? he was the one shouting there is not bubble, government quit restricting the private sector, and let the power of the free market show you what it’s worth. by the way, that is exactly what the government did. nice outcome.
you argue we should not have promoted anti-growth regulations (i don’t think you really understand what anti-growth regulations occurred during that era) and yet in your first statement you propose a bunch of regulations aimed at exactly that. even with 20-20 hindsight, you still are making contradictory statements. in real time (not 20-20 hindsight) how would stronger lending standards (which should be enforced by banks and investors, not the government, anyway) not be considered anti-growth by the conservative business establishment?
Baffling, you’re either dishonest, in denial, or playing politics, because I showed you the evidence, several times, that politicians in Congress created the moral hazard in the housing market.
It was a government-induced housing bubble.
And, there are more costly regulations now, e.g. In health care, banking, energy, transportation, housing, etc. that we all pay for one way or another.
Peak Trader: So the deregulatory zeal in the Office of Thrift Supervision in the mid-2000s had no relevance? And the development of CDS and explosion in private label CDO’s did not have a large role in the boom/crash. Finally, is Congress to blame for the housing property boom in the euro periphery?
Professor Menzie Chinn, I did not say all regulations should be eliminated.
The main driver of the housing bubble was high risk loans that lenders wouldn’t have made without the support of the federal government.
Lenders, investors, some homeowners, and homebuilders made a lot of money, while the bubble was forming, along with foreigners, since the risk was diversified worldwide.
Congress made it easier for Americans to buy homes with unintended consequences.
peak
“It was a government-induced housing bubble.”
you are wrong. period. don’t let your ideology get in the way of reality. in your world, the private sector will never need to take responsibility because you will always find a way to blame the risky action on the government. this is hogwash and rubbish-and an excuse for poor private sector behavior. your comments on regulatory costs are equally bogus-conservative talking points without support.
” is a good idea if it’s worth the higher growth in the present.”
Yes, well, Govt isn’t particularly good at investing for economic returns.
Anonymous: I’ll have to remember that the next time I think about DARPA and the internet…
anonymous, actually government is very good at investing in assets that are very difficult for bean counters to quantify. hence the interstate system, water and sewer systems, internet, national defense, etc. i think you fall into the talking point trap that government is inept without giving it serious thought. these are assets that have tremendous value, unfortunately at this point bean counters have been unable to develop an accurate method for evaluating them. the problem is not poor government investment. the problem is bean counters are not good enough at this point in time to accurately deal with these assets. it seems to be more of a private sector deficiency.
Prof. Chinn, Menzie (or what do You prefer from somebody like me ?)
I wonder what you make of the German yield landscape, with a 30-year yield (pre-tax) of just 0.62% ?
With a commitment to close, but slightly under 2% inflation, a 27% tax rate on such “profits” (cough)
And even the IMF case Portugal having a 0.29% lower risk premium than the US ?
Could it be that
a) the Euro safety core impacts the US picture significantly
b) the ECB way to get the peripherey mess cleaned up will keep rates down for a very significant time (> 5 years)
c) that all those old correlations and assumptions have lost relevance