The economy has steadily been moving closer to the Fed’s long-run objectives. But we’re still not there yet.
Congress has given the Federal Reserve the dual mandates of maintaining price stability and full employment. The Fed has interpreted this in practice to mean an inflation rate of 2% and an unemployment rate a little under 5-1/2 percent.
Why not try to get unemployment even lower? Economic theory and historical experience suggests that an unrealistically low target for unemployment is unsustainable. According to this view, there is a level of the reported unemployment rate, sometimes referred to as the “natural” rate of unemployment, such that if we tried to keep unemployment any lower than that rate, the inflation rate would steadily increase every year. The Congressional Budget Office estimates that the natural rate of unemployment is currently around 5.4%.
The data graphed below provide some weak support for that theory. The vertical axis marks the difference between the inflation rate in year t and the rate in year t – 1. I measured inflation using the year-over-year percent change in the PCE deflator as of February of each year, choosing February because that’s the most recent month for which we have a 2015 value for the PCE deflator. Dots above the y = 0 axis correspond to years when the inflation rate was higher than the year previously. The horizontal axis marks the difference between the unemployment rate (again measured as of February in each year) and the natural rate of unemployment as estimated by the CBO. Dots to the right of the x = 0 axis correspond to years when the unemployment rate was above the natural rate. The dots trace out a weak negative correlation (R2 = 0.13, slope = -0.34, Newey-West t-statistic = -2.3). The relation suggests that if we maintained an unemployment rate at 4.4% (one percentage point below the estimated natural rate), the inflation rate during this year might be expected to come in at 0.6% (or 0.3% above the current 0.3%), the following year at 0.9% (or 0.3% above next year’s anticipated inflation rate), and so on. We couldn’t stay in such a situation forever, though obviously there’s a lot of error in the equation’s predictions.

The relation graphed above is one version of the Phillips Curve. The underlying theory motivating the form I’ve used in the graph above is based on a model of adaptive expectations in which people expect an inflation rate this year equal to whatever they observed inflation to be last year. I have elsewhere discussed some other approaches to incorporating inflation expectations into the Phillips Curve. If people catch on more quickly that inflation is headed up than is implied by the adaptive expectations assumption, the increase in inflation would come faster than predicted by the regression estimated above.
The second objective of the Fed is to keep inflation around 2%. Many people understand why the Fed doesn’t want to see inflation above 2%. But why is it a bad thing when inflation gets below 2%? If we could count on inflation every year of 1%, there probably isn’t much of a problem. But the issue is that we can’t count on that. A 1% target in practice means some years with negative inflation (also known as deflation). The concern is that if we get hit with a big enough deflationary shock, that could put the economy into a deflationary spiral in which unemployment gets stuck well above the natural rate and prices fall every year, aggravating debt burdens and accelerating bankruptcies. The U.S. managed to avoid a deflationary spiral in the Great Recession of 2007-2009, but these unfavorable dynamics likely did play a role in worsening the economic loss during the Great Depression of 1929-1933.
Federal Reserve Bank of Chicago President Charles Evans has proposed summarizing the Fed’s inflation and unemployment objectives in terms of a bull’s-eye picture. I’ve centered the bull’s-eye below assuming a long-run inflation target of 2% and a natural unemployment rate of 5.35%. We’d like to be as close to the center of the target as possible. We’re about there in terms of the unemployment objective, but inflation is still well below 2.0%.
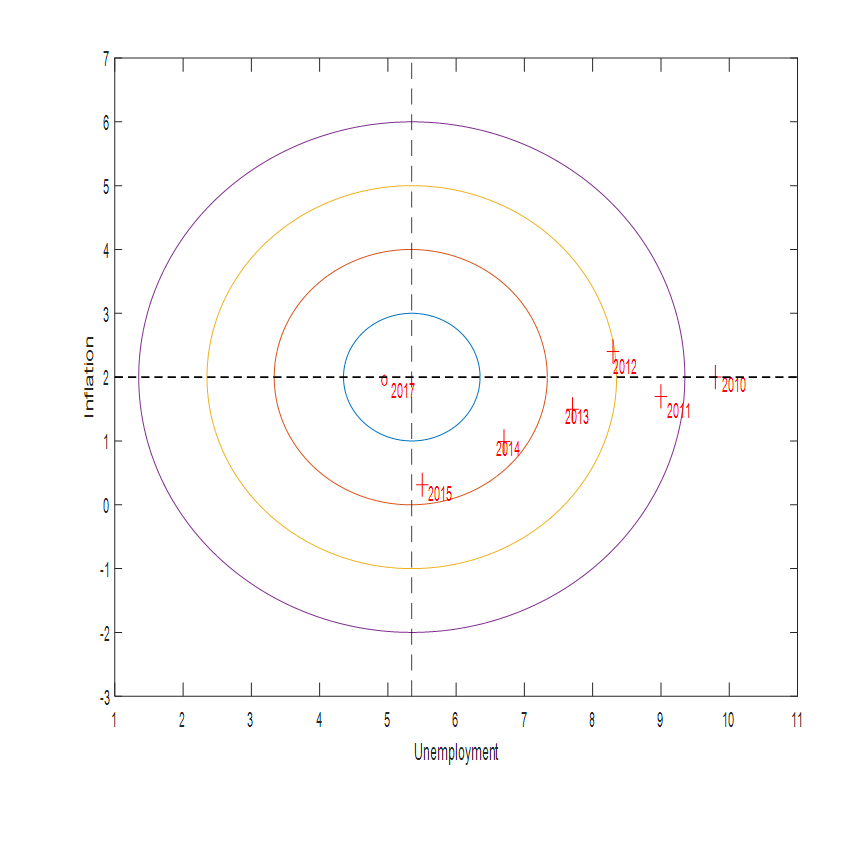
Horizontal axis: civilian unemployment rate. Vertical axis: inflation rate as measured by year-over-year percent change in implicit price deflator for personal consumption expenditures. 2017 entry represents FOMC projections. Crosses denote values for February unemployment and February year-over-year inflation for indicated year. Adapted from Evans (2014).
The tricky thing about navigating to the target is that the economy responds with a considerable delay to any actions the Fed takes today, and there is a lot of uncontrolled variability in both inflation and unemployment. Nevertheless, the above quick calculations persuade me that it is too early for the Fed to start raising interest rates. At its March meeting, the FOMC declared:
The Committee anticipates that it will be appropriate to raise the target range for the federal funds rate when it has seen further improvement in the labor market and is reasonably confident that inflation will move back to its 2 percent objective over the medium term.
I’d want to see some more data before being reasonably confident about that second item.
The last time annual inflation was above 3% was 24 years ago when it was 3.21% and falling.
http://research.stlouisfed.org/fred2/series/PCETRIM12M159SFRBDAL
Why is inflation a threat to our economy now?
better yet, why is it so hard to generate inflation when you can print unlimited amounts of money?
First, does your analysis include any data prior to 1971 when Nixon took us off of the gold standard? One of my earliest memories of my interest in economics came back in the early 1960s when I heard a Progressive economist announce on CBS that with the new Keynesian economics, a normal unemployment rate was no longer 4.5% but 5.5%. I was young, about 12 years old, but I became angry. If the new Keynesian economics increased unemployment by 1.0% it was a failure. Many talk about the new normal. Well, the new normal is a worse country than the old normal. Why not return to the old normal when people could work, when they could save without worrying about losing 20% of their savings every 10 years, and people were encouraged to create new businesses not discouraged.
Such talk still makes me angry. We pay for Keynesian economic policies with an additional 1.0% of unemployment!
Then right after that you lost me at, “The relation graphed above is one version of the Phillips Curve.” The Phillips Curve was debunked in the 1970s. Why do you persist in living in a failed economics of the past.
Mr. Hamilton,
This story reminds me of some lines by William Shakespeare.
GLENDOWER: I can call spirits from the vasty deep.
HOTSPUR: Why, so can I, or so can any man; But will they come when you do cal
The welsh rebel Owen Glendower could indeed call the fearful spirits of the lower realms but has his fellow rebel Henry “Hotspur” Percy rightly notes what is important is not being able to call them but to have them respond. The Federal Reserve Bank (FRB), indeed any central bank, can set any target it wants and create expectations that it will trying mightily to achieve those targets but at the end of the day, what happens in the economy is what matters. The FRB has been targeting a 2% inflation rate and a 5.5% unemployment rate for a number of years now but has as yet to achieve both, one not at all and the other only sporadically a few years ago.
The problem is not setting the target or in provide forward guidance to the market place that they central bank wants to achieve the target. The problem is that the economy may simply not be able achieve those targets. The United States is economy that exports most new capital formation and new domestic capital is for activities with low economic multipliers. Such an economy might simply be unable to generate inflation, low employment, or high nominal gross domestic product, i.e. has inherently limited growth potential.
Owen Glendower’s problem was not that he could not target the appropriate spirits to call or that he did not provide the aforementioned spirits with adequate forward guidance as to what he wanted them to do but that no such spirits actually existed or they impotent in the needed powers. The FRB’s problem is not that they have chosen the wrong target but that the US economy is not able to achieve those targets.
The Fed has done an excellent job preempting inflation and smoothing-out business cycles.
However, the Fed has already tightened the money supply by reducing and removing quantitative easing.
One theory is raising the Fed Funds Rate 25 basis points in June will show the Fed means business in keeping inflation expectations low, although there seems to be tremendous slack in the labor market.
Then, the Fed will have more credibility in preempting inflation in a slow tightening cycle, e.g. the Fed Funds Rate rising to 1% in 2017, and markets may be more confident stronger growth is on the horizon, to create a self-fulfilling prophecy.
Peak,
“The Fed has done an excellent job preempting inflation” by creating economic decline. There is no “inflation” because the government has created wedges that prevent production and economic growth. As a matter of fact this is the whole theory behind an “over-heated” economy. The FED and government take steps to hinder economic growth in an effort to cool off the heat. Consider that if there were no economic transactions there would be no price increases no heat. But the government and FED cannot create production. Only business producers can do that. The government can hurt the economy, or they can hurt it less.
Concerning smoothing out business cycles, they have made the declines longer. The Great Depression was over 10 years long. The Great Inflation was almost 10 years and without Volker would have probably much longer than 10 years. The Great Recession is currently around 8 years long and still “recessing.”
The U.S. has had much faster per capita real growth, since the Fed was established and since we went off the gold standard.
You can praise the Fed later for the faster (compounded) growth that resulted in a much higher standard of living today than otherwise.
Peak,
Your statement is only correct if you sweep inflation under the rug, but notice below that while nominal (inflated) GDP increased after the creation of the FED, real GDP declined. As a side note if you remove the Reagan growth and the years when Volker and Greenspan essentially used the price of gold to set monetary policy, growth is horrible, even using the Keynesian measure of GDP.
GDP 1796-1914
3.87 nominal
3.89 real
GDP 1914-2014
6.35 nominal
3.35 real
Can you give me a reference that backs up your claim?
Ricardo, I responded to your statement before:
Average annual per capita real GDP growth
1871-1914: 1.56% (height of the Industrial Revolution)
1982-2007: 2.30% (height of the Information Revolution)
1814-1913: 1.39%
1914-2013: 2.15%
Economic boom/bust cycles (not to be confused with asset booms and busts) are inefficient both in the boom and bust phases, because of periods of strain and slack. Sustainable growth is optimal growth (rather than feasts and famines or floods and droughts). Monetary and fiscal policies smoothed-out business cycles.
And, here’s a link:
http://www.measuringworth.com/growth/
Peak,
Your comment intrigued me and I did a little research. Can you name any economic crisis or panic before the creation of the FED that lasted 10 years or longer?
Thy myth that has been perpetuated is that since the creation of the FED the economy has been more stable, there have been fewer declines, and generally the FED has smoothed out the business cycle. But that myth is not true. Recessions have been more frequent since the creation of the FED and the serious economic declines have been much longer.
I do not believe the FED can be blamed for the increase in economic crisis and the increased length of declines but neither has the FED done anything to make them shorter or less severe. Most of the economic problems before or after the creation of the FED have been caused by intervention of the government, usually congress, to disturb markets and cause dislocations. The very first economic crisis was in 1792. It lasted for 2 months and was resolved quickly by Alexander Hamilton. It was significantly caused by William Duer, Duer used insider information he learned from his position as Alexander Hamilton’s first Assistant Secretary of the Treasury. He conspired with prominent bankers to use large loans to gain control of US debt securities that was part of Hamilton’s plan for the First Bank of the US.
Hamilton found out about the scheme and essentially hung Duer out to dry. Over and over when you look at the economic panics they were caused by criminals trying to use the government to enrich themselves.
The Long Depression
The National Bureau of Economic Research dates the contraction following the panic as lasting from October 1873 to March 1879.
At 65 months, it is the longest-lasting contraction identified by the NBER, eclipsing the Great Depression’s 43 months of contraction.
In the US, from 1873–1879, 18,000 businesses went bankrupt, including hundreds of banks, and ten states went bankrupt, while unemployment peaked at 14% in 1876, long after the panic ended.
******
The Depression of 1893
The Depression of 1893 was one of the worst in American history with the unemployment rate exceeding ten percent for half a decade.
During this period population grew at about 2% per year, so real GNP per person didn’t surpass its 1892 level until 1899.
The depression, which was signaled by a financial panic in 1893, has been blamed on the deflation dating back to the Civil War, the gold standard and monetary policy, underconsumption, a general economic unsoundness, and government extravagance.
******
List of recessions in the United States – Wikipedia
Recessions in the Industrial Revolution – 1871-1914
Period – Percent Decline of Business Activity
1873-79 – 33.6%
1882-85 – 32.8%
1887-88 – 14.6%
1890-91 – 22.1%
1893-94 – 37.3%
1895-97 – 25.2%
1899-00 – 15.5%
1902-04 – 16.2%
1907-08 – 29.2%
1910-12 – 14.7%
1913-14 – 25.9%
Recessions in the Information Revolution – 1982-2007
Period – Percent of Contraction
1990-91 – 1.4%
2001 – 0.3%
It should be noted, immigrants during the Industrial Revolution had roughly the same skills as the domestic population. So, if the U.S. population doubled from immigration, GDP also doubled.
In the Information Revolution, immigrants were less skilled, in general, than the domestic population. So, if immigration doubled, GDP would less than double.
During the Industrial Revolution, the average workweek for factory workers was 10 to 12 hours a day, six days a week. On the farm, it was from sunrise to sunset. It was common for children to work in factories and farms.
Small economies tend to grow faster than large economies. Of course, most women didn’t work at paid jobs and families had more children.
“The U.S. has had much faster per capita real growth, since the Fed was established and since we went off the gold standard.”
Simply False.
The real US growth rate switched from 1 to 2% after the civil war, long before the Fed
http://de.slideshare.net/genauer/sampler-2-of-imf-2014-weo-data-plots , page 8
please also compare to the 300 year history of the UK, page 9
everything properly referenced
Peak,
The NBER was not around in 1873. They use Keynesian analysis based on declining prices not deflation. There is a difference. Industrial production was innovating at such a huge rate that he stable dollar’s purchasing power was soaring. If you look at industrial production you will find that the period after the Civil War in the US was one of the greatest in our nation’s history.
You also might note, in the discussion of the gold standard, the huge inflation after the Civil War caused by Lincoln’s fiat “greenback.” Additionally, you should note the destruction caused by the silver inflationists with the 1878 Bland-Allison Act and the 1890 Sherman Silver Purchase Act. These were blatant market manipulations forcing the government to buy silver (making the US the 2nd largest purchaser of silver of any country in the world) by issuing silver certificates that could be redeemed for gold. This led to a run on gold pushing the Treasury to its statutory limit. Most of the gold standard deniers perpetuate the myth that the US was on a gold standard for the entire 19th Century. Actually, the 19th Century was the period of the greatest battles surrounding the gold standard and often the opponents significantly damaged the value of the dollar as noted above.
I have seen your list of recessions before and they are based on Keynesian analysis. For industrial production and real asset creation, the US 19th Century has not been surpassed in world history. The Keynesian analysis include huge variances due to debasement of the dollar. Because Keynes is not a capital based system it is subject to huge errors due to monetary fluctuations. Keynesian economists spend huge amounts of time attempting to identify and correct for monetary errors but they always lack precision in their numbers.
Genaur, if you are going to claim someone is wrong you should at least cite the same data.
The claim was that per capita growth was better after the fed was created and you replied by citing straight growth.
By the way the UK had its own central bank for most of the period you cite, so really you are also claiming countries grow faster after they have a central bank.
There is little “real slack” in the labor markets. You post missing this completely. From a labor market standpoint, jobs are easy to come by right now in a modern service sector sorta way. There is also little inflation pressures due to several factors which means there is little pressure to raise wages unless you see a fall off in quality, which obviously is happening in low wage departments.
Spencer,
I am sure you know the difference between the BofE in the 19th Century and the US Federal reserve in the 20th and 21st Centuries, but others may not. The BofE did nothing but maintain the exchange value of the pound Sterling and exchange the pound for gold at the defined rate. The US Federal Reserve since the Great Depression has manipulated the currency not to maintain the exchange value but to manipulate the economy. The BofE was extremely successful at its job, the US Federal Reserve has been so bad that under sane conditions it would have been dissolved long ago.
The progression in your “target” graph of the unemployment and inflation numbers simultaneously declining since 2012 would seem to offer, um, weak support for the notion of a Phillips curve, or at least a Phillips curve that is stable enough to count for anything in terms of making policy.
Mr. Hamilton, many people have commented that the Fed’s 2% target is, in fact, not a target but a cap. If expectations (of future Fed activities) count for anything, the use of such a cap would suggest that the Fed is confining itself to an incredibly narrow window of acceptable outcomes. Do you think it would be wise for them to ease up on the upper bound of acceptable inflation if they really want to hit 2%?
Likewise, I just read on another blog a post that argues that if the Fed won’t allow inflation over 2%, that would take any option–monetary or fiscal–to significantly stimulate the economy to higher growth effectively off the table, as the Fed would have to slam on the breaks almost immediately. Is it possible that the Fed’s obsession with its inflation-fighting credibility is in itself a big part of our problem in seeing higher growth?
I appreciate your opinion on such a question. Thanks again for running such an interesting blog.
William Meyer: Note that the 2010-2015 points are all included in the scatterplot and regression reported above.
I am very much arguing that 2% should be a target which we should dislike being under as much as we dislike being over.
They seem to consistently undershoot inflation.
I haven’t had a chance to properly review this analysis, but it suggests disability insurance and other factors are affecting labor force participation.
http://conference.nber.org/confer/2015/Macro15/Barnichon_Figura.pdf
The downward track of those date-dots over time suggests that the NAIRU you have picked is too high. Why should we see 5.35% as NAIRU?
macroduck: I took 5.35% from the FOMC long-term projections of unemployment. CBO says 5.4%.
Thanks Jim
Another good and insightful note. I think that the Fed should be modeling for some unexpected risks / shocks such as a persistent trend in the core price levels on both sides of the AD/AS curve and the impact of real wages on price trends and expected future core inflation. Looking at the 10-year bond yields from the US to Germany, there is a big message in the market at the moment: if you start to tighten, expect excess bond market volatility and in turn equity volatility that spills over onto the expectation set of investors and consumers and pushes up the level of risk aversion. Hence, a much shyer investing corporate America and also don’t forget the impact of the International capital flows into the US$ and external volatility caused by an early moving Fed.
Managing the upside when there are clear signals, such as 3-4 quarters of core inflation ranging in the 2-2.5 percent range, real wages growth in quality jobs, not part-time low skilled retail positions, and evidence of sustained nonresidential investment spending for at least 3-4 quarters, would make much more sense than simply speculating on the future about “the coming boom” as some officials and forecasters continue to do.
The shock of 2008/09 is not easily forgotten and in my view central banks to many forecasters are not weighting that recent event enough as it relates to why aggregate demand is weak, supply is high, and the US and globe remains in a falling price level regime. This current macro climate ‘is not” 1970 nor will it be next year so Fed officials should stop speculating and listen to the data and appreciate the recent past and put a lot of that info into their vector auto regression modeling….
http://www.valuewalk.com/2015/04/john-hussman-eating-our-seed-corn-the-causes-of-u-s-economic-stagnation-and-the-way-forward/4/
http://www.hussmanfunds.com/wmc/wmc110404.htm
“Phillips demonstrated a principle that is well-known to every economist: very simply, when a useful resource becomes scarce, its price tends to increase relative to the prices of other goods and services.That finding doesn’t need all sorts of intellectual contortions or modeling tricks to make it ‘work,’ because it is one of the most basic laws of economics. The true Phillips Curve, then, is a relationship between unemployment and real wages.”
An enormous amount of human misery could be avoided if central bank authorities were attentive to this fact, and abandoned their endless bubble-blowing exercises in the hope of exploiting some tradeoff between unemployment and general price inflation that simply does not exist. Pursuing general price inflation does not somehow “buy” more jobs. It also does not raise real wages. It lowers them.
While the demand for fixed investment, durable goods, and housing all respond to variations in interest rates, that response is limited. Interest cost is only one of many considerations that go into the investment decision – particularly for large capital investments. All of that normal variation in interest rates can be captured by straightforward policy feedback rules such as the Taylor Rule. Extraordinary departures from such fixed rules have no material correlation with subsequent economic activity. They simply distort the financial markets.
At potential, i.e., business cycle peak?
http://effectivedemand.typepad.com/ed/2015/04/is-real-gdp-at-potential.html
“Wealth effect” from successive Fed/TBTE banks’ asset bubble pumping? “Price stability”? “Smoothing out the business cycle”? At what costs? To whom? Who benefits? What is the Fed’s ACTUAL mandate?
http://research.stlouisfed.org/fred2/graph/fredgraph.png?g=18sl
http://research.stlouisfed.org/fred2/graph/fredgraph.png?g=18sm
What I have never understood is how an inflation rate (price increase) of 2% with a corresponding increase in wages means anything. Granted the Cantillon effect instructs us that such inflation is never smooth across all sectors but that only seems to compound the foolishness. When (as if they could) the government creates 2% inflation are they not favoring those who borrow (the mechanism of increasing the money supply) against wage earners and consumers.
At one time economics had to conform to logic and reason but over time it has created its own logic that has little to do with reality. Thank goodness it is the mother who does most of the consuming in society rather than academic economists. Consumption is too important to be left to the academics.
You know the reason; keeps the debt parade going.
LOL! Yep.
The foundation of Keynes theory: conspicuous consumption and ultra-materialism. Dig those holes and fill them up! It is spending not production that feeds the world – NOT!
Is that the Core PCE you’ve plotted in the bulls-eye graph? It doesn’t look like it. Unless I’m mistaken, this measure has been below 2% every year since 2008, except for just one year when it was right at 2%…
So, basically the Fed has repeatedly missed its inflation target.
Also, the discussion of why lowflation is bad here is of course not complete. With downward nominal rigidity, lowflation = inefficient, and after a balance sheet recession, large debts are made worse by slow inflation…
Thorstein Veblen: This is the year-over-year percent change in the actual PCE, not core.
Two points:
1. There is an additional reason to prefer a positive inflation rate. If you go to this page and click on the “Distribution of wage changes” tab, you’ll see a histogram of reported nominal wage changes for U.S. workers who have not changed jobs during 2013Q4 to 2014Q4. What stands out immediately is the spike at 0, i.e., no change in wages, and how few people ever have their nominal wages cut. For whatever reason, nominal wage cuts are a pretty rare occurrence. In other words, downward rigidity of nominal wages is a feature of the real world.
Because nominal wages are hardly ever cut, significant cuts in real wages can only happen in the presence of significant inflation. In a world constantly buffeted by supply and demand shocks, it is sometimes necessary for an employer to reduce the real wages he pays or go broke. If he can’t actually cut the real wage of current workers, he has to get rid of some of them. If there was a bit of inflation going on, he could just freeze the nominal wage and let his real wage bill fall by the inflation rate.
2. The Phillips curve tends to disappear during periods of stability due to the “thermostat effect.” If you have a room heated and cooled by an adequately-sized heat pump governed by a functioning thermostat, the temperature in that room will stay near the thermostat setting no matter what happens to the weather outside. If you were to plot the indoor temperature against outdoor temperature, or indoor temperature against electricity usage, you would see no relation on either plot. Alternatively, think of observing the position of the accelerator pedal in a car driven over a hilly road by a skillful driver. Just looking at the pedal position would tell you nothing about the speed of the car, nor would observing the hills. The driver keeps the speed more or less constant so there’s nothing to see.
If the Fed is trying to stabilize the unemployment and inflation rates and is good at doing so, you won’t see much relationship between them, mostly because neither varies all that much.
The very weak part of this article is its argument that low inflation is problematic.
“If we could count on inflation every year of 1%, there probably isn’t much of a problem. But the issue is that we can’t count on that. A 1% target in practice means some years with negative inflation (also known as deflation). The concern is that if we get hit with a big enough deflationary shock, that could put the economy into a deflationary spiral in which unemployment gets stuck well above the natural rate and prices fall every year, aggravating debt burdens and accelerating bankruptcies.”
There is no evidence that deflationary shocks are more powerful when inflation starts at an already low level. As you acknowledge we’ve had only one episode in the past century in the US that clearly qualified as a deflationary shock: the Great Depression. It seems hard to argue that a 1pp difference in the 1929 pre-recession inflation rate would have significantly ameliorated or exacerbated the depth of that deflationary shock. It seems more logical that higher pre-crisis inflation would have been followed by deeper deflation as the policy drivers of higher inflation would have been suddenly overwhelmed and reversed.
I also see a lot of weak arguments and misinformation in the comments.
@Thorsten – It’s a very dubious contention that one or two pps higher inflation would make an important enough difference to real wages to significantly boost hiring; other effects of higher inflation might be worse. In any case the nominal rigidity of wages is an argument for wanting higher inflation during a recovery, not for preferring 2% over 1% inflation generally. The fact that higher inflation would be better for debtors is no argument that it would be better for the economy. If the central bank had been more moderate before the last crisis there would have been less high-interest debt that had to be repaid after unsustainable housing growth collapsed.
@Ricardo, Peak – There is no difference in business cycle volatility between the pre-Fed and Fed era. Neither the lack of a central bank nor the gold standard are guards against episodic rapid money supply expansion. Financial sectors with or without central banks and with or without the gold standard tend to behave fairly similarly, pumping out money in early expansions and tightening as signs of misinvestment (eg inflation) appear. The gold standard is after all just an exchange rate peg, and one that was often manipulated so that gold was not really available at its notional price. The US effectively quit the gold standard in 1933; 1971 was just removing the last small remnant.
If you’re looking for a monetary policy regime change that really mattered and whose results can be easily seen, look at Volcker’s tightening in 1980, which ushered in two decades of relatively high interest rates relative to growth and relatively stable growth rates over time, I think justifiably called the Great Moderation. I would date the end of that period to 2002 when Greenspan returned to a policy similar to pre-1980 eras of holding base interest rates far below growth rates.
PS I think a more relevant topic now re: Fed policy would be the limits of Fed power. Raising base interest rates does not have as large of an effect on rates charged to the private sector as many people assume. Look at the last tightening cycle: mortgage rates and corporate bond rates hardly responded, moving at most 5bps for every 25bps of federal funds rate move. A 25bps hike would mainly affect FX rates and the government’s cost of borrowing, not credit to the private sector.