Wisconsin employment falls in March; continues to lag the Nation.
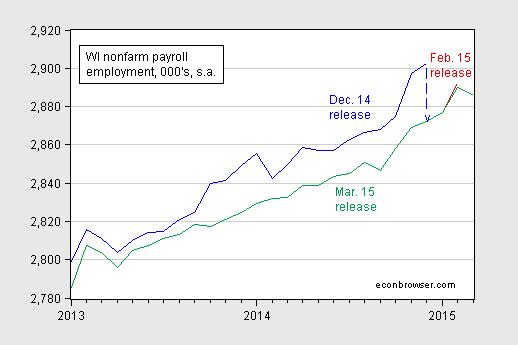
Figure 1: Wisconsin nonfarm payroll employment from December 2014 (blue), February 2015 (red), March 2015 (green). March release from DWD. Source: BLS, and WI DWD.
The big shift downward is due to the benchmark revision to figures, using figures from the QCEW through September 2014 (see discussion here).
Of course, one should not put too much weight on one observation, especially a preliminary one. Greater reliance should be put on trends. Here, established trends remain in place.
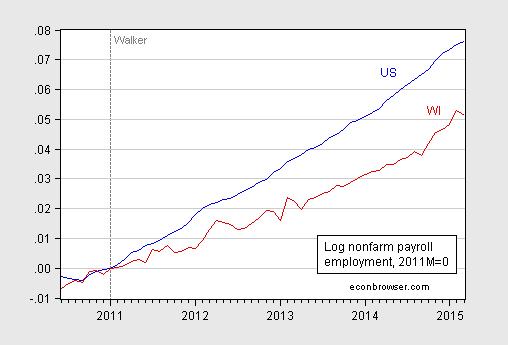
Figure 2: Log US nonfarm payroll employment (blue), Wisconsin(red), both normalized to 2011M01=0. Source: BLS, and WI DWD.
The divergent trends apparently have had some impact on popular opinion.
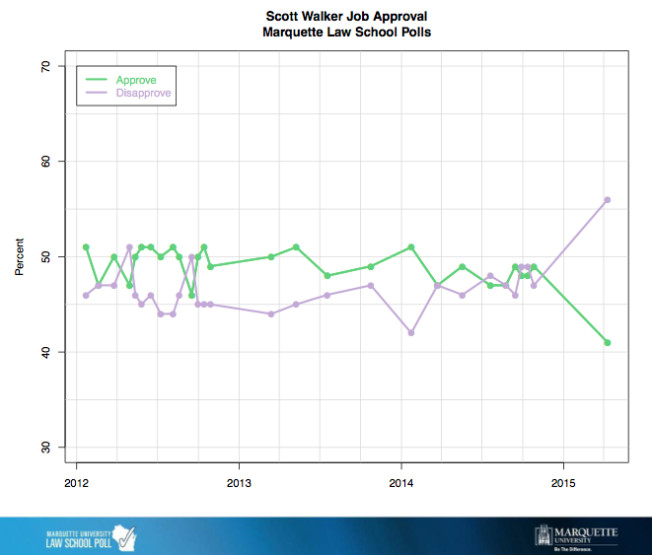
Figure 3: sourced from Marquette Law School poll.
From the Marquette University Law School Poll (4/16):
Voters also see the state’s employment situation as turning down compared to other states, with 52 percent saying that Wisconsin is lagging behind other states in job creation, 34 percent saying that the state is doing about the same as other states and 8 percent saying that the state is creating jobs faster than other states. In October, 42 percent said the state was lagging, 38 percent said about the same and 13 percent said Wisconsin was creating jobs faster.
Update, 4/18 2:30pm Pacific: David L. Hagen writes:
Wisconsin unemployment has declined from 8.1% to 4.6% under Governor Walker.
Bruce Hall observes that Wisconsin unemployment rates are not that bad, at 18th in the country.
These are (if one will excuse me) mind-numbingly stupid comments (if they have been written by people who have had high school statistics), to the extent that (1) unemployment rates have come down nationwide, and (2) Wisconsin’s unemployment rate is almost always below the national average. In Figure 4, I show the US-Wisconsin unemployment differential adjusted by the 1976-2010 average differential.
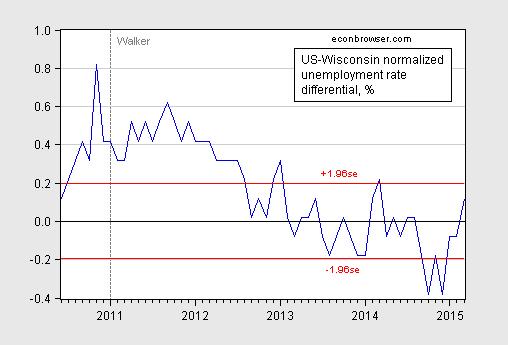
Figure 4: US-Wisconsin unemployment rate differential, adjusted by 0.76 ppts, in % (blue), and +/- 1.96 standard error band (red). Differential estimated using OLS, HAC robust standard errors. Source: BLS, and author’s calculations.
That is, Wisconsin’s performance along the unemployment rate dimension is well within what is to be expected.
Update, 4/20 7:30am Pacific: Reader Bruce Hall argues for normalizing and adducing a kind of “fixed effect” on the basis of the last peak. In a separate email to me, he argues that he does not believe that there is an average difference between US and Wisconsin unemployment rates at business cycle peaks. Here is a time series graph using available data (easily accessible at FRED) of the differential.
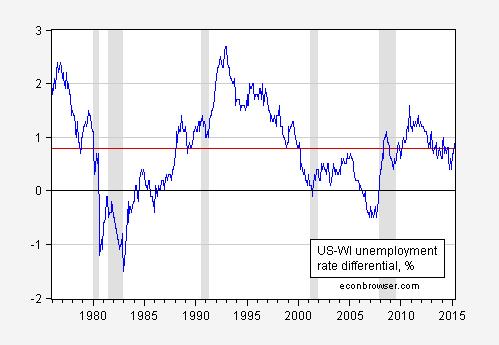
Figure 5: US-Wisconsin Unemployment differential, s.a., in % (blue), and average over 1976M01-2015M03 period (red). March WI unemployment rate from DWD. NBER defined recession dates shaded gray. Source: BLS via FRED, WI DWD, NBER, and author’s calculations.
http://www.bls.gov/web/laus/laumstrk.htm Only #18… come on Walker. No wonder Wisconsinites are upset. Hell, the basketball team was #2.
http://www.bls.gov/lau/maps/stseries.pdf
When do you stop pushing against a wall? Shouldn’t employment acceleration be constant? Just like a sports car that keeps accelerating past the speed of sound because there are no practical limits?
And if things are so good, why this? http://research.stlouisfed.org/fred2/graph/?id=MPRIME, Should not the Fed have done something?
Reminds me of the comments on Mark Thoma’s site regarding CEOs being paid too much. Gee, 50,000 Ford union workers are only getting profit sharing of $7,000 each while the CEO gets paid $5 million. Mark Fields is doing a lousy job and is grossly overpaid.
Throw out a statistic without context and hope it sticks. We all can play that game.
Walker’s policies hidden in a proposed state budget that wrecks havoc on education (http://www.channel3000.com/news/education/UW-Madison-says-400-jobs-to-be-cut-under-Walker-budget/32423472 ) takes away support for some of the state’s most vulnerable citizens (http://www.postcrescent.com/story/news/local/2015/04/17/tom-nelson-sounds-family-care/25921523/) and his short sighted refusal to take Medicaid funds (http://milwaukeecourieronline.com/index.php/2015/04/18/walkers-wisconsin-success-story-is-just-that-a-story/ ) have led to $2 Billion state budget deficit has left state legislators and local municipalities in a terrible bind. And now Wisconsinites are having to struggle to clean up a mess while the person responsible jets off to conferences and dinners to chase campaign funding so he can move to his next political gig.
Scott Walker states on facebook:
Graph: Wisconsin unemployment has declined from 8.1% to 4.6% under Governor Walker.
Comments?
My comment is “Whoop-de-doo.” The US unemployment rate has dropped more in the same time period 9.1 to 5.5%), in a time when the U.S. Labor force is expanding a whole lot faster than Wisconsin’s.
Anyone who thinks Scott Walker’s economic policies have been anything other than an under forming failure is either 1. Paid to say so, 2. Clueless about economic stats and the facts behind the Obama Recovery or 3. GUTLESS. There are no other options.
David L. Hagen: I suggest you learn some statistical analysis, including the concept of fixed effects. I have added an update to the post responding to your request for comment.
Menzie, let’s presume one can actually pinpoint the level of “fixed effects” on an economic unit (city, state, country). What’s “normal”? What’s “fixed”? What’s “other”?
For example, the average unemployment rate for 2006 for the U.S. was 4.6% while Wisconsin’s was 4.7%. By 2010, the U.S. was 9.6% and Wisconsin was 8.7% (so presumably Wisconsin had a favorable “fixed effect” of about 1% versus the U.S. in total???). By 2014, the U.S. was at 6.2% while Wisconsin was at 5.5% (so presumably there a narrowing of this “cushion” as the economy normalized).
In March, the U.S. unemployment figure stood at 5.5% and Wisconsin 4.8% – February (http://stats.bls.gov/eag/eag.us.htm) with Wisconsin having a preliminary March number now reported at 4.6%.
So, relative the the U.S., it appears that Wisconsin experienced a somewhat milder recession and has “normalized” somewhat sooner (2006-2015). The question then remains, “Is Wisconsin’s present 4.6% an indicator of Gov. Walker’s good performance or is the fact that the rest of the U.S. which lagged Wisconsin, but is now improving faster toward “normal” because Wisconsin has already done so, an indicator of Gov. Walker’s poor performance? Or is there another problem here?
Bruce Hall: To quote, “You keep on using that word. I do not think it means what you think it means”.
A fixed effect in a panel regression context is the alpha[i] in: y[it] = beta[0] + beta[1](x[it]) + alpha[i] + u[it]
Okay, that’s the formula. My thought was that fixed effect(s) … the underlying things that make Wisconsin different from Iowa or Arizona or the U.S. in total (population growth, education levels, heavy industry, average age, whatever) … would tend to manifest themselves in different responses to economic changes. So, states like Wisconsin that may be dependent on both heavy industry and agriculture might examined differently from states that were primarily agricultural or primarily heavy industry.
I’ll admit that the intricacies of selecting the variables that dummy out some of the change is more than I’d want to tackle, but doesn’t it boil down to an analysis that says “all things being equal” when, indeed, all things are not equal, this is the expected outcome? So can we presume a certain period was “normal” and that based on the differences in the underlying parameters for each state we would expect different outcomes for some very basic economic factors?
For example, 40-years ago, I used to prepare a model for inflation-adjusted automotive parts sales that was modified for factors such as 6-year vehicles in operation, average miles driven, and average age of vehicles. There were six or seven such factors that were used to adjust the historical sales data that presumably accounted for change that was not performance driven. Then the adjusted data was correlated with general economic data to a fairly high r-squared of about .95. Given that we had a pretty good handle on near-term adjusting factors, we could get a pretty good estimate of what the next years sales should be and throw in a “performance factor” if the VP was so inclined.
This kind of modeling was useful because parts sales were a leading indicator of a recession and a lagging indicator of recovery. If we saw parts sales declining despite all of the adjustments to the raw data, we could consider budgeting for a more sluggish economy and lower sales the next year. This would affect decisions about inventory levels and incentives.
But with regard to Wisconsin’s unemployment rate changes versus other states and the U.S. economy, I guess I’d be lost trying to factor out all of the variables that cause apples to oranges in order to apples to apples. So, I was trying to see if there was a “normal” level of unemployment (neither a downturn nor an upturn period) that could be used as a proxy for a far more complex approach of attempting to adjust for 50 different variables. If 4.8% unemployment is normal several years into a recovery, then getting back to 4.8% is the goal … all things being equal. Sure, that’s a rough measure that doesn’t account for a lot of significant structural changes such as oil exploration and production in North Dakota (which has aided Minnesota’s economy, too). But those are pretty obvious changes.
To my knowledge, Wisconsin has not benefited or suffered from any significant underlying factors (versus the U.S. general economy) since 2006. So, is it unreasonable to look at “normal” rates of unemployment as well as “normal recession” levels as relative indicators of how states’ economies are performing (in the absences of specific, obvious, large disruptive factors)? Of course it is a simplistic approach, but why is it incorrect? If Wisconsin was expected to stay somewhat “insulated” from the recession because of the various factors that make Wisconsin different from other states and the nation… and it was… and if Wisconsin was expected to return to “normal” levels of unemployment sooner than the nation in general … and it did … what is the bone that is being picked?
Menzie
How is Minnesota doing? While its unemployment rate number has been good for some time, I note that number of SA nonfarm employment has been flat for about 9 months. Also as I noted in previous posts, Minnesota’s leading indicators has plunged to 0, which I believe is indicating the coincidence index should shortly begin a similar plunge. Do you expect that? I continue to speculate the lag from Minnesota’s unreasonable tax increases of 2013 is over and the consequences are now here. Do you have any better stats for the future on Minnesota?
Ed
Ed Hanson: I think your comments are based on views garnered before the employment statistics were “benchmarked”. According to MN DEED data, MN is again pulling away from WI (MN nonfarm payroll is 6.6 percent above 2011M01, WI is 5.1 percent, in log terms). In March preliminary numbers from state agencies, MN gained, WI lost.
The coincident indices were recently revamped, given the new benchmarked establishment employment statistics, and new statistics indicate MN is growing. Newly revamped leading indices (which forecast the coincident indices) will be released at the end of this week.
I will note that whatever surge occurred in WI relative to MN was largely erased by the benchmarking to QCEW data (see the post a few weeks ago). What WI surge remains is post-Sept 2014. This is interesting as the QCEW data were available only up to 2014M09, so whatever is after that date is based on the surveys, which thus far have been overestimating Wisconsin employment.
Fortunately, the country on average has been catching-up on employment.
Wow, so instead of having a discussion, you resort to snarky “updates”. Disappointing to say the least. I thought I expanded sufficiently on what I was saying to at least get a civilized response. Instead, it appears you have chosen to not even allow the comment.
I’ll presume you simply had a bad day.
Bruce Hall: Who cast aspersions on the veracity of the statistical approach adopted (one, by the way, I have explained repeatedly on this blog)? To quote:
Why, it was you. If you are to make such disparaging remarks, then I think one should not be surprised to be met with a rejoinder which befits the remark.
Menzie, thanks for the additional data which, indeed, show that Wisconsin has had an historically lower unemployment rate than the U.S. – on average. The raw numbers related to your figure 5 are found in the “Back Data” here: http://stats.bls.gov/eag/eag.us.htm
The low/high range of unemployment rates for the U.S. is 3.9% (Sep-Dec 2000) to 10.8% (Nov-Dec 1982).
The low/high range of unemployment rates for Wisconsin is 3.0% (May & Jul 1999) to 11.9% (Jan 1983).
The variability at any given time is a range of approximately +2.7pp to -1.5pp. The Wisconsin mean variance appears to be approximately +0.8pp.
Wisconsin’s March unemployment rate is 4.6% while the U.S. rate is 5.5%. I calculate Wisconsin’s rate as +0.9pp versus the U.S.
Given the 4.2pp range of point-in-time Wisconsin vs. U.S. variations and the Wisconsin +0.1pp March variation to its historical advantage over the U.S. (on average), I’m uncertain as to how any real conclusion can be drawn about Walker’s impact one way or the other on unemployment rates. It appears that during the Reagan years, Wisconsin had a slower recovery from the recession than the U.S.; during Clinton and Obama administrations Wisconsin appears to have recovered more quickly than the U.S. and then tailed of more as the expansion matured. Under the Bush administration, the U.S. fared better than Wisconsin.
So, the questions are:
* Was Wisconsin’s relatively good performance early in the recoveries under Clinton and Obama a measure of the U.S. poor performance or Wisconsin’s good leadership?
* Was Wisconsin’s poor performance relative to the U.S. during the Bush administration a measure of the U.S. good performance or Wisconsin’s bad leadership?
* Was Wisconsin’s continued improvement relative to the U.S. during the Reagan administration a measure of U.S. declining performance or Wisconsin’s good leadership?
* Is Wisconsin’s declining, but basically “average” performance versus the U.S. during Walker’s administration an indication of the U.S. economy finally gearing up or Walker’s failure to exceed long term average employment advantage for Wisconsin?
You see, I can be convinced, but I also like to go beyond “averages” to get to the back story.
Bruce Hall: Because the estimate of the mean differential is estimated with greater precision, the precision increasing with the number of observations, then one can reject the null hypothesis of a zero differential at any conventional significance level.
I think I agreed with that and conceded that there was, historically, a mean difference of approximately 0.8pp between the Wisconsin and U.S. unemployment rates.
Given that concession, my questions then related to the observed differences which you have been using to criticize Gov. Walker’s performance (or lack thereof).
Bruce Hall: My apologies, I was responding to:
I agree one can’t say anything except that just before Walker took office, US unemployment was statistically significantly higher than WI, and during Walker’s term, US unemployment has fallen faster so that WI is at its average value relative to the US, using these data. Nonetheless, not great performance.
I do not typically bring up unemployment rates because of the low precision associated with the household survey. I only mentioned this data because you did.
If you want to see an “explanation” for why employment has lagged, (re-)consider this post, which you commented on earlier. Keep in mind state government employment proxies for state government expenditures; then think of an economy with slack.
Okay, thanks.
Professor Chinn,
If you used EViews,, would you mind posting the file, so I could understand how you are using the fixed effects model? Sorry if I missed your repeated explanations as mentioned above. For me, some endeavors are not like riding a bicycle, I for one get very rusty if I have not done some statistical operations more than once or twice per year.
Thanks!
Look, this is an extremely simple test of expansionary austerity. The results are clear as day. The change to austerity has worsened WI in comparison to how it used to perform when compared to the US as a whole. Just face it, cutting government spending is not helpful in a depressed economy.
Menzie, please write an academic journal article based on these results so we can cite it in the future…
XO,
Menzie and I have gone back and forth regarding the “fixed effects” impact. Once the longer timeline and data were provided (see figure 5), it is more apparent that over the past 5 decade Wisconsin has averaged about an 0.8 pp advantage (lower) unemployment rate… and I accept that this is a proxy for explaining the structural/demographic differences between Wisconsin and the U.S. affecting average unemployment rates.
When you relate figure 5 back to figure 4, you get a better perspective of near term versus long term performance. As I noted in a previous comment, Wisconsin’s unemployment rate… adjusted for the 0.8 pp “natural” differential… would seem to indicate that Wisconsin’s present 0.9 pp advantage makes it about “average” after that 0.8 pp adjustment.
Given that Menzie has been particularly critical of this relatively modest variation from the longer term advantage that Wisconsin has enjoyed versus the U.S. in unemployment rates, I asked the following questions based on figure 5:
* Was Wisconsin’s relatively good performance early in the recoveries under Clinton and Obama a measure of the U.S. poor performance or Wisconsin’s good leadership?
* Was Wisconsin’s poor performance relative to the U.S. during the Bush administration a measure of the U.S. good performance or Wisconsin’s bad leadership?
* Was Wisconsin’s continued improvement relative to the U.S. during the Reagan administration a measure of U.S. declining performance or Wisconsin’s good leadership?
* Is Wisconsin’s declining, but basically “average” performance versus the U.S. during Walker’s administration an indication of the U.S. economy finally gearing up or Walker’s failure to exceed long term average employment advantage for Wisconsin?
These are not entirely rhetorical.
All you need to see is that since Walker took over, and imposed massive austerity, the performance goes down in comparison. It is a brutally simple test, and expansionary austerity fails that test. There would have to be some omitted variable that change WI’s performance at exactly the same time that Walker takes over, but does not hit MN or the US . And there is nothing like that.
And for additional robustness, he has also shown this failure for Brownback’s austerity in KS, and tested many models specifications. There must be 25 posts on this, and in each one expansionary austerity fails.
And let’s be clear that Walker’s claim was for IMPROVED economic performance by slashing budgets, not simply keeping par with the US. That absolutely did not occur. Contractionary fiscal policy is contractionary.
I think this is an honest appraisal of Walker’s tenure, which if anything may be too mild. Is there any information at the state level on discouraged workers or the change in start-ups and new firms?
From the census bureau:
People QuickFacts Wisconsin USA
Population, 2014 estimate 5,757,564 318,857,056
Population, 2013 estimate 5,742,953 316,497,531
Population, 2010 (April 1) estimates base 5,687,289 308,758,105
Population, percent change – April 1, 2010 to July 1, 2014 1.2% 3.3%
Then I ran a comparison of Wisconsin’s employment to total U.S. employment which can be found in this file:
https://www.dropbox.com/s/srngnca75uffjex/SeriesReport-Wisconsin%20employment.xlsx?dl=0
You will see that from the beginning of 2010 to present, while Wisconsin’s population growth has lagged the U.S., Wisconsin’s share of total employment has been markedly increasing. The file takes data back to 1980 and provides highlighting for data ranges of 2.4%-2.7%, 2.7% to 3.0%, and over 3.0%. You will be able to see the changes over time, during the last recession, and for the Walker administration.
Sorry, the .xlxs format didn’t seem to be digested well, so I resaved as an .xls (older version). Hopefully this works better.
https://www.dropbox.com/s/h1v2w50qqb1qpzo/SeriesReport-Wisconsin%20employment.xls?dl=0
Okay, I give up with Dropbox. Sorry for any inconvenience.
Here is the relevant monthly data from 2008 to present:
2008 3.24% 3.24% 3.24% 3.24% 3.24% 3.24% 3.23% 3.23% 3.23% 3.22% 3.21% 3.19%
2009 3.18% 3.16% 3.14% 3.13% 3.12% 3.12% 3.11% 3.10% 3.09% 3.09% 3.08% 3.08%
2010 3.08% 3.08% 3.09% 3.09% 3.09% 3.10% 3.10% 3.10% 3.10% 3.10% 3.11% 3.11%
2011 3.11% 3.12% 3.12% 3.12% 3.12% 3.12% 3.12% 3.13% 3.13% 3.13% 3.14% 3.14%
2012 3.14% 3.14% 3.14% 3.14% 3.14% 3.14% 3.15% 3.15% 3.15% 3.15% 3.16% 3.16%
2013 3.16% 3.16% 3.17% 3.17% 3.17% 3.18% 3.18% 3.18% 3.18% 3.19% 3.19% 3.20%
2014 3.20% 3.20% 3.21% 3.21% 3.21% 3.22% 3.23% 3.23% 3.24% 3.24% 3.25% 3.25%
2015 3.26% 3.27% 3.27% 0.00% 0.00% 0.00% 0.00% 0.00% 0.00% 0.00% 0.00% 0.00%
CORRECTION
As much as I hate to ever admit I made a mistake, it appears that my statement that Wisconsin was gaining share of total U.S. employment was erroneous. There was an error in the formula for calculating those values in the spreadsheet. The more I thought about the confusion and contradictions that I perceived in the data, the more I felt compelled to recheck everything.
The fact is that Wisconsin has been LOSING share of the U.S. employment total all the way back to 1980. I certainly can’t pin that on any one person because it seems a fairly consistent losing battle.
My apologies to everyone on this.