The March establishment series estimate for nonfarm payroll employment clearly fell far short consensus estimates (release). Here are a couple of quick observations.
Not only was overall employment growth preliminarily estimated to be low; earlier months’ estimates were also revised down.
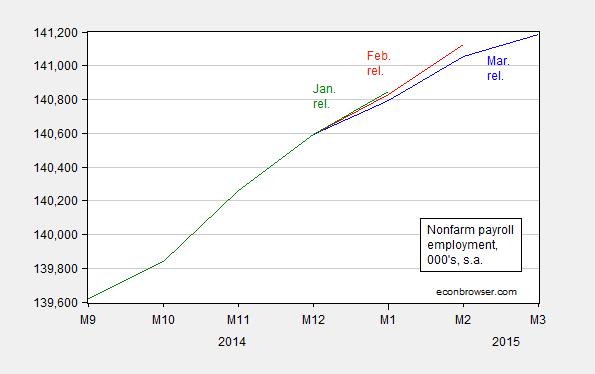
Figure 1: Nonfarm payroll employment in ‘000’s, seasonally adjusted, from March release (blue), from February release (red), and from January release (green). Source: BLS.
One should never put too much weight on one month’s preliminary figures. It’s important to keep in mind that the mean absolute error of the m/m changes going from 1st release to 3rd release is 45,000. [1] Still, lackluster employment growth in this month reinforces my view that we should not be overly concerned about an overheated labor market. In my view, we are still some way from full employment.
To me, the more interesting aspect of the release involves the sectoral breakdown. Some have pointed out the drop in leisure and hospitality employment, which seems unlikely in their view to be sustained. For me, the more worrying aspect is the decline in manufacturing employment over time. In 2015M03, the change is -1 thousand (so doesn’t show up in Figure 2 below).
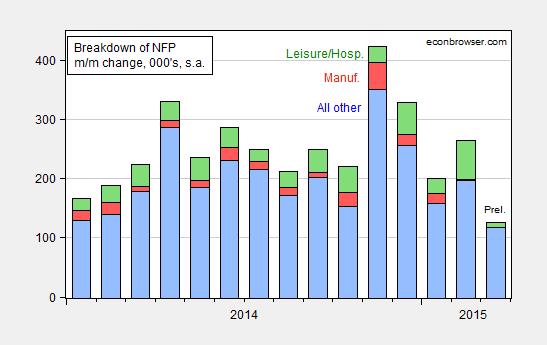
Figure 2: Month on month change in nonfarm payroll employment minus leisure and hospitality and manufacturing, in ‘000’s, seasonally adjusted, from March release (blue), manufacturing (red), and leisure and hospitality (green). Source: BLS and author’s calculations.
This suggests worrying trend in tradables sector economic activity, and hence continued concern about the dollar’s value. [2]
More from McBride/CR, Portlock/WSJ RTE, Mitchell/WSJ RTE, and Tim Duy. See also Furman/CEA.
Update, 4/4 2:45PM Pacific: Here is a graph of growth rates in the dollar, and indicators for manufacturing.
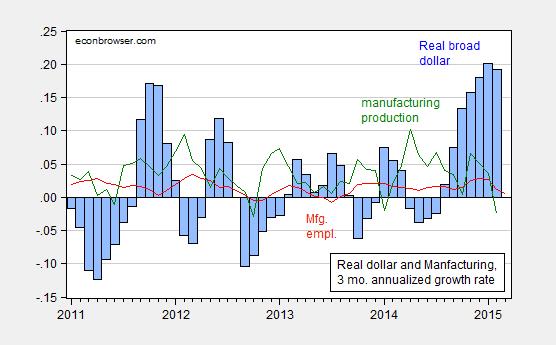
Figure 3: Three month annualized growth rate in real value of dollar (trade weighted, broad basket) (blue bars), and in manufacturing employment (red line), and in manufacturing production (green lines), all annualized, calculated in 3 month log differences. Source: Federal Reserve Board, BLS, all via FRED, and author’s calculations.
For other views on the dollar, see Riccadonna, Wright and Yamarone/BloombergBusiness.
Total 4th quarter job growth was unsustainable however. A slowdown was expected and a rebound from March is also expected(jobless claims are already blinking). The economy only needs 120-125 thousand jobs to keep up with our tepid population growth. 150-175 to make modest headway. I am not seeing much dollar impact. This isn’t even a strong dollar historically. Most of it was M/M slowdown from the surge of the 2nd half of 2014, which without the shippers strike, would have been even more of a surge.
I think wage growth is accelerating as well. BLS usually lags by 6-12 months and that is not a new feature. I had this same argument on this same blog in 2005. By 2006, you were backtracking like mad.
As I’ve shared before, US Treasury withholding receipts imply that employment peaked in summer to early fall ’14. Therefore, employment might be overstated since Oct-Nov, which is quite typical at business cycle peaks and as the economy decelerates to stall speed late in the cycle.
The crash in the price of oil and the deflating of the shale bubble has already begun to drag on orders, IP mfg., and now mfg. employment. Because mining and oil and gas extraction and the energy-related transport sector was disproportionately skewing higher orders and overall IP since ’11-’12, the deflating of the shale bubble will similarly disproportionately drag on IP mfg. in the months ahead.
IP mfg. has decelerated since Nov to a -2.5% annualized rate. Watch IP mfg. for the tell-tale sign of recessionary conditions if it were to dip below 3% YoY. The acceleration required to avoid falling below the 3% YoY and SAAR threshold will have to be rather strong hereafter. A seasonal bounce from Polar Vortex II could do it, however. Q2-Q3 YoY comparisons for ’15 for IP and GDP are going to be tougher.
http://research.stlouisfed.org/fred2/graph/fredgraph.png?g=16sE
http://research.stlouisfed.org/fred2/graph/fredgraph.png?g=16sG
http://research.stlouisfed.org/fred2/graph/fredgraph.png?g=16iT
The trade data do not imply growth but rather the converse.
http://research.stlouisfed.org/fred2/graph/fredgraph.png?g=16sI
The proxy for real final sales per capita (business, household, and gov’t income less net exports and the federal gov’t’s fiscal deficit) is at or below historical “stall speed” (especially on a 4-qtr. change basis) prior to the onset of recessions.
A reminder that the yield curve does not invert prior to recessions during debt-deflationary regimes of the Long Wave as occurred in the 1830s-40s, 1890s, 1930s-40s, and Japan since 1998. The economy does not contract because of tightening capacity, credit, and bank reserves. Rather, the economy “stalls” because of insufficient growth of income after taxes and debt service.
Therefore, the Fed will not raise the funds rate, the fiscal deficit is set to rise, and the Fed will likely resume QEternity later this year to fund the deficit to prevent decelerating nominal M3 (after bank cash assets/reserves) and GDP from contracting in 2015-16.
The historical precedent for “stall speed” of income is for a recession in the 4-6 qtrs., a bear market of ~35% (48-55% given the high valuations), the Fed required to print $600B-$1T more, and the U rate rising by 50-100% (unless the labor force participation rate falls commensurately, which is possible because of peak Boomers leaving the labor force en masse).
Menzie,
Do you care to elaborate a bit more (maybe an additional post, even?) on the following:
“In my view, we are still some way from full employment.”
What are the empirics that have swayed you towards this view? I’m just not certain where I stand on this view.
There hasn’t been much job creation beyond population growth, after the severe recession, and older workers have been working longer, in this deep depression.
Nominal and real GDP growth remain low. The economy is underproducing by a huge amount each year. There has been a lot of lost output in this L-shaped recovery.
We lost 8.7 million jobs in the recession.
We created 11.5 million jobs, since the start of the recession.
So, we had an average increase of 33,000 jobs per month, since the economy peaked in December 2007.
However, if we needed 125,000 jobs per month, since December 2007, to keep up with the population growth, then we need over 7.5 million more jobs.
rtd: See this post, which elaborates on the Ball-Mankiw methodology extended in an earlier post.
Even if one-third of the output gap has been destroyed, we’d still need over 5 million jobs beyond population growth.
Private hours worked grew at a 2.2% annual rate from the fourth to the first quarter.
But most forecasters are expecting first quarter real GDP growth to be less than this.
This implies continued very weak productivity and that unit labor cost growth will be larger that the increase in the business deflator.
If so you should expect another decline in profits or S&P 500 EPS in the first quarter.
The bottom-up estimate of first quarter S&P 500 EPS is now negative. The primary determinate of business fixed investment is corporate profits. So the question becomes how weak will the economy be in 2015 without anything driving growth — could be weaker than in 2014.
I’ve built a spreadsheet that uses Census population projections and a 2006-7 baseline of age-specific participation rates [which were virtually constant going into the recession] to calculate the number of jobs needed to keep up for population growth corrected for the aging of the baby boomers. On that basis I get a sharp decline, from 105,000 jobs a month in 2007 to 60,000 jobs a month in 2015. Still, the gap between “normal” employment, given the age structure of our population, and the most recent numbers is 6.3 million. Now the participation rate of older ages is rising (from roughly 49% in 2004 to 54% in 2015) so this is if anything an underestimate, particularly if the rise in education numbers for the 16-19 and 20-24 age brackets is a temporary response to the lack of jobs rather than a permanent shift.
Yes, the Baby-Boom demographic shift has caused some destruction of potential output.
Michael, see here: http://tinyurl.com/lmqsxkp
This follows the implied post-2007 rate of real final sales per capita of ~0% and real GDP slower than 1%.
The record low for labor’s share of GDP and record debt to wages and GDP will drag on labor productivity, and thus on real growth, indefinitely hereafter.
But Wisconsin beat Kentucky, so all is well.
the fiscal deficit is set to rise, and the Fed will likely resume QEternity obat kista coklat tradisional later this year to fund the deficit to prevent decelerating nominal M3